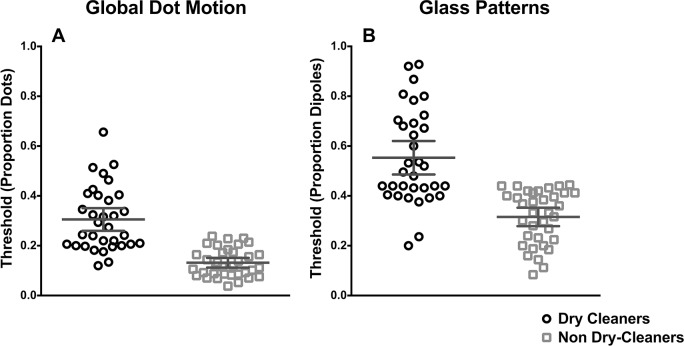
Fig 5. Coherence thresholds (proportion signal dots/dipoles) for the detection of GDM (A) and Glass patterns (B).
In each plot individual thresholds are clustered for dry cleaners (squares) and non dry-cleaners (circles). Indicated in both figures are horizontal lines representing the group mean. Error bars represent 95% confidence intervals.

