FIGURE 4.

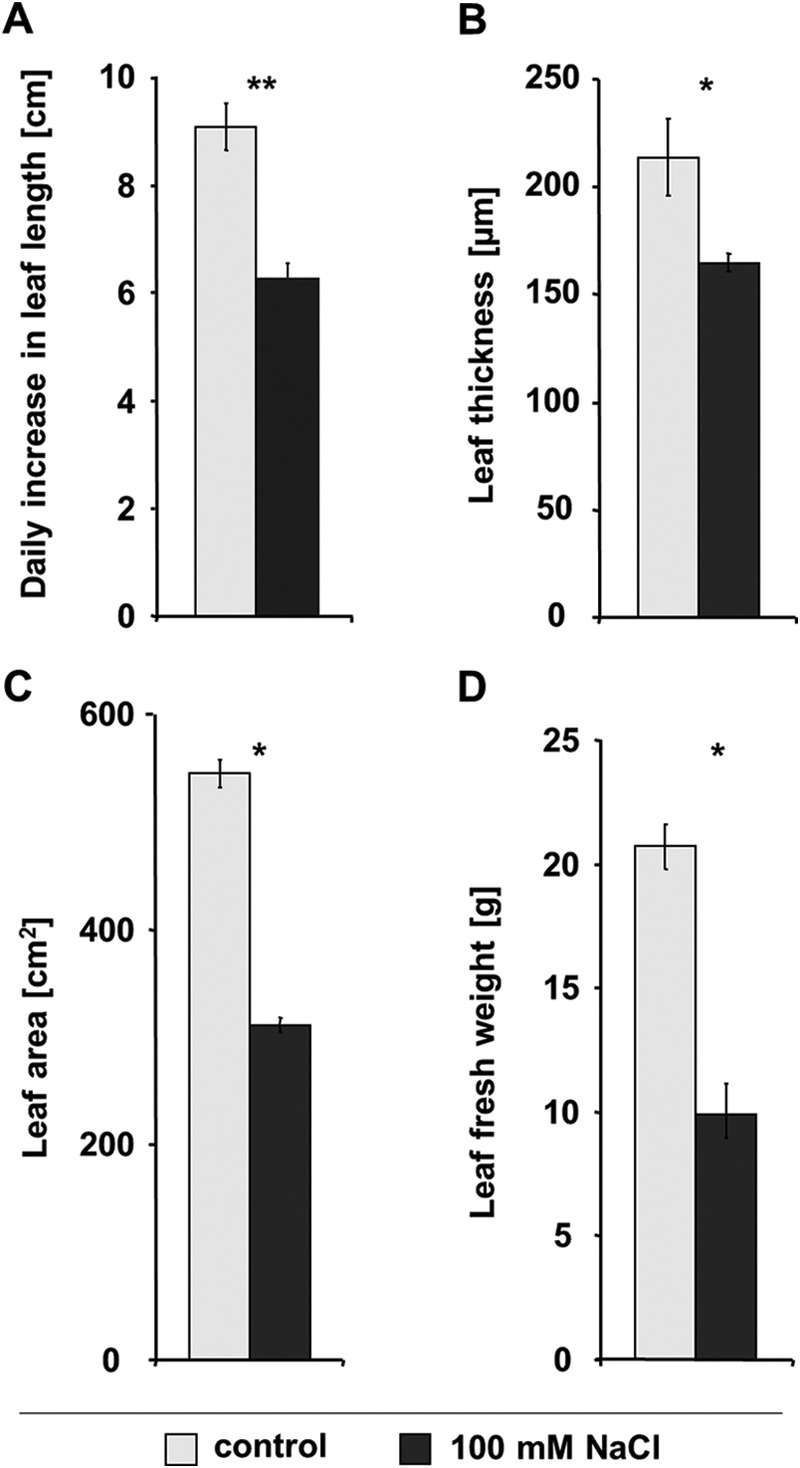
Salinity-induced leaf growth inhibition. Leaf growth and biomass formation with 8-day 100 mm NaCl treatment. Shown are the daily increase in leaf length as averaged over the 8-day salt treatment (A), leaf thickness (B), leaf area (C), and leaf fresh weight (D), each at the last day of the 8-day 100-mm NaCl treatment (A). Light gray, control; dark gray, 100 mm NaCl. All measurements are the means of four biological replicates ± S.E., each replicated in triplicate. Asterisks indicate mean differences betweens salt treatment and control (*, p ≤ 0.05; **, p ≤ 0.01; ns = not significant; t test).
