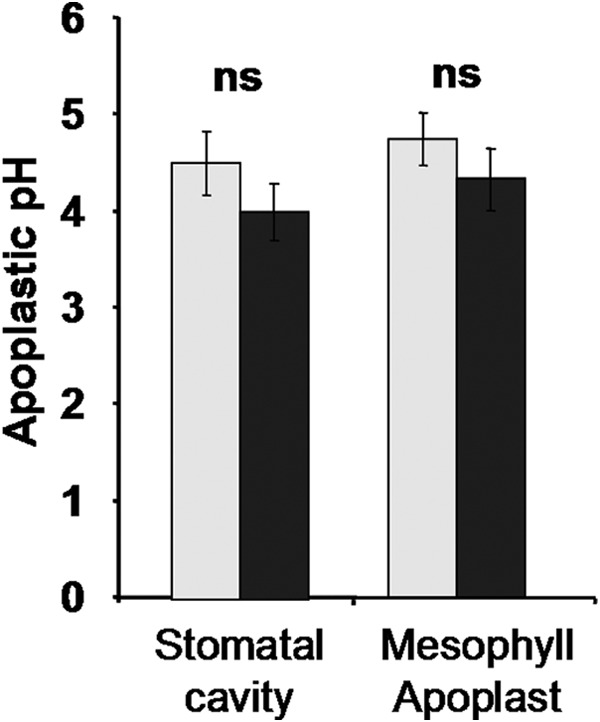
FIGURE 8.

Leaf apoplastic pH. In planta quantitation of apoplastic pH in intact maize leaves under control and NaCl-stress conditions is shown. Leaf apoplastic pH as quantified in the stomatal cavities and in the apoplast that is surrounded by the mesophyll cells. Light gray, control; dark gray, 100 mm NaCl. Measurements were conducted on 45 different plants, with 5 regions of interest quantified for each apoplastic subcompartment. Thus, each mean is based on 225 single data points. Error bars indicate S.D. The t test was calculated based on de-logarithmized pH values.
