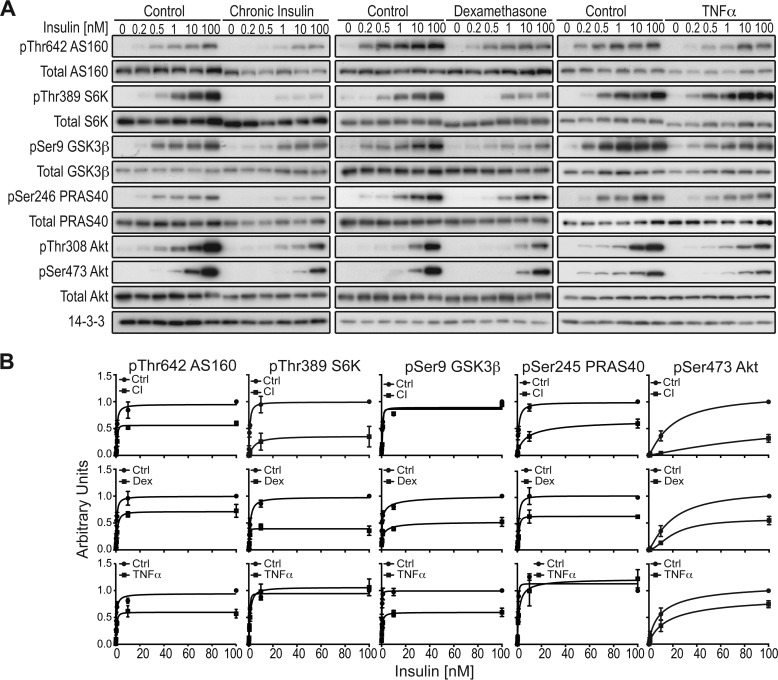
FIGURE 4.
Phosphorylation of the Akt signaling network in insulin-resistant 3T3-L1 adipocytes. A, control or insulin-resistant 3T3-L1 adipocytes were treated with the indicated doses of insulin. Cell lysates were immunoblotted using indicated phospho and total antibodies. B, quantification of the blots depicted in A of n = 3 independent experiments. Ctrl, control.

