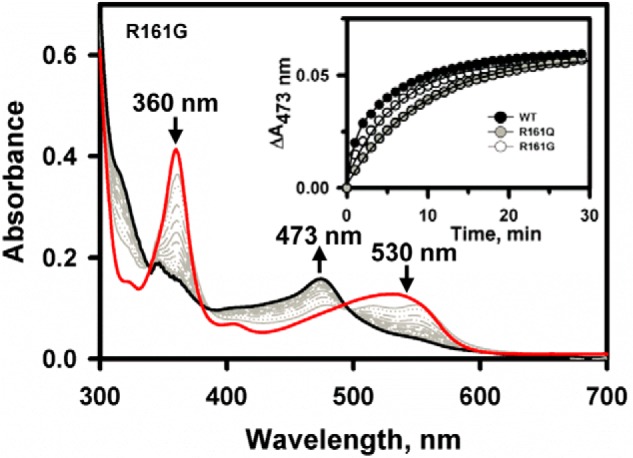
FIGURE 5.

Decyanation kinetics of wild-type and mutant CblCs. Shown are changes in the UV-visible absorption spectrum of CNCbl (20 μm) bound to R161G CblC (50 μm) in Buffer A at 25 °C following addition to a mixture of methionine synthase reductase/NADPH (4 μm/200 μm) under anaerobic conditions. The initial spectrum is in red, selected traces over the reaction course are in gray, and the final spectrum at 60 min is in black. The inset shows the reaction kinetics monitored at 473 nm for wild-type (black circles), R161Q (gray circles), and R161G (open circles) CblC.
