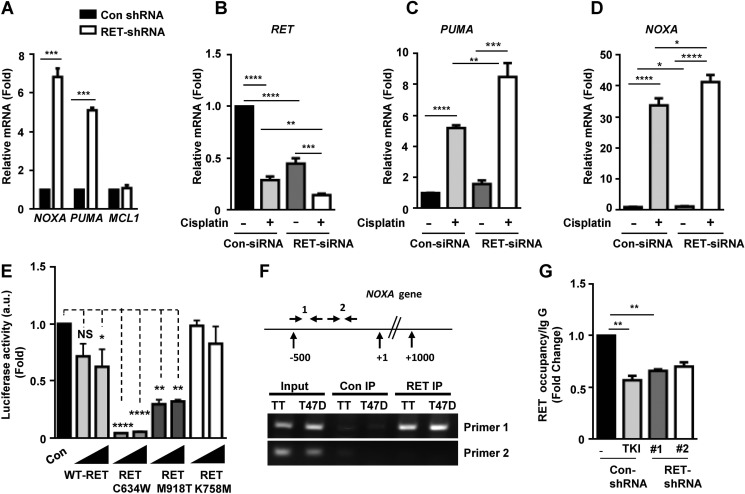
FIGURE 2.
RET represses NOXA and PUMA expression and NOXA promoter activity. A, quantitative real-time PCR showing mRNA levels of NOXA, PUMA, and MCL-1 in control shRNA and RET shRNA 1 TT cells using S18 mRNA as internal control. Data are shown as means ± S.D. (error bars) performed in triplicate from three independent experiments (Asterisk indicates p value, ***, p = 0.0006, Student's t test). B–D, MZCRC1 cells were transfected with control and RET siRNAs for 48 h and treated with cisplatin (100 μm) for 24 h. Quantitative real-time PCR shows mRNA levels of RET (B), PUMA (C), and NOXA (D) in control siRNA and RET siRNA cells. Values were normalized against HPRT mRNA levels. Shown are means ± S.D. of triplicates from two independent experiments (unpaired Student's t test). E, RET kinase activity is required for repression of NOXA promoter activity. Reporter assays in transfected HEK293T cells with the NOXA reporter and increasing amounts of WT RET, active mutant RET (RETC634W, RET-M918T), or kinase-dead mutant RET (RET-K758A) plasmids. Normalized luciferase enzyme activity (a.u. indicates arbitrary units) is presented as mean ± S.D. of triplicate samples from one representative experiment. F, schematic of the NOXA locus and the primers used in ChIP experiments. Shown is the ChIP assay for RET occupancy at the NOXA gene in TT cells and breast cancer T47D cells. RET occupancy was observed within a region close to the proximal NOXA promoter as amplified by primer set 1 (primer set 1 amplifies a genomic region −500 bp from the transcription start site; primer set 2 amplifies a genomic region +500 bp from the transcription start site. G, ChIP assays indicating RET occupancy at the NOXA promoter in TT cells treated with TKI (10 μm vandetanib for 8 h) and RET shRNA TT cells. Data are shown as means ± S.D. from two independent experiments. The statistical analysis used was unpaired Student's t test; **, p = 0.0048.

