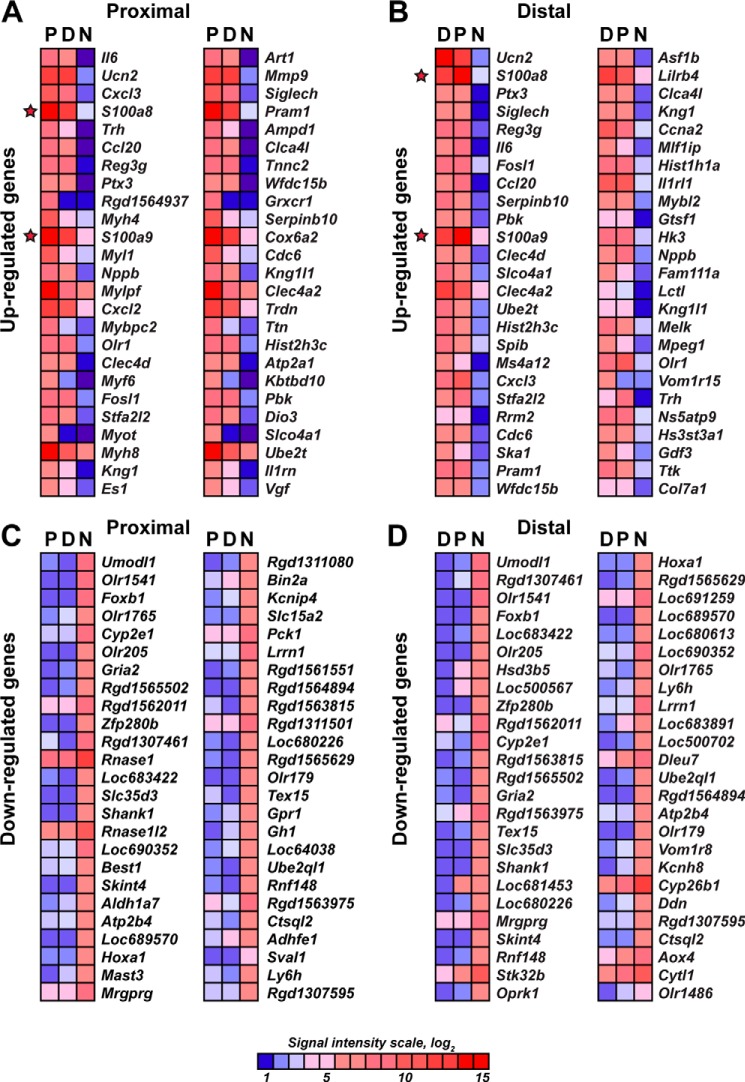
FIGURE 1.
A–D, heatmaps of the genome-wide transcriptional profiling data of the axotomized (day 1) rat sciatic nerve. Red and blue correspond to high and the low expression levels, respectively. The color map shows the signal intensity scale. The top 50 up-regulated (A and B) and top 50 down-regulated (C and D) genes in the proximal and distal segments are shown. Only statistically significant data (p < 0.05) were used in our analysis. The S100a8 and S100a9 genes are highlighted with stars.

