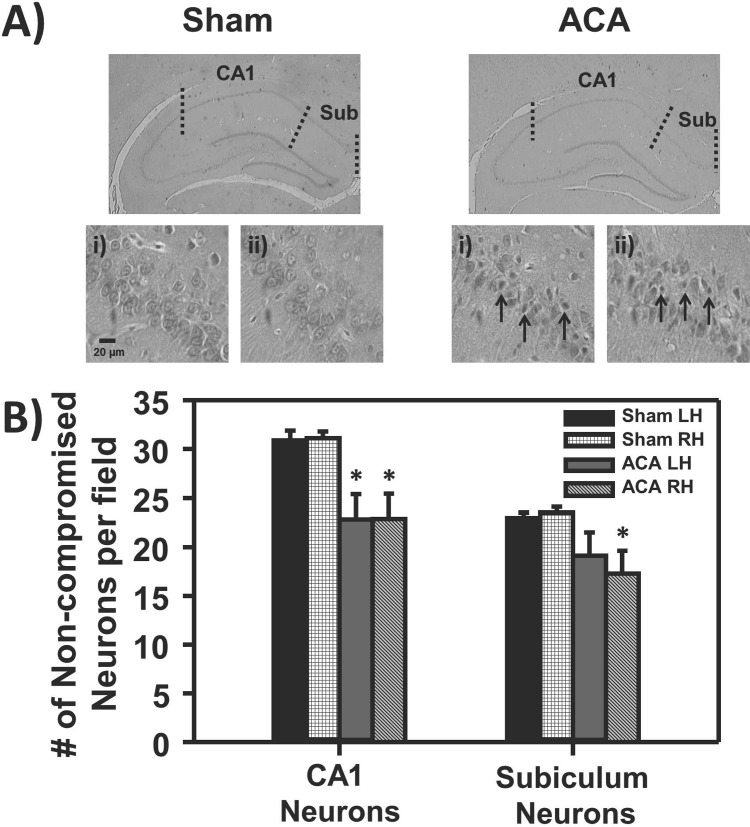
Fig 2. Histopathology of the hippocampus seven days following Sham or ACA.
A) Representative histological images of hippocampal coronal slices of Sham and ACA animals with 40X images of the i) CA1 and ii) subiculum region. There was a visible increase in small pyknotic and eosinophilic cells (arrows) following ACA in the CA1 and subiculum regions. B) Bar graph depicting the number of non-compromised neurons per field to left (LH) or right (RH) hemisphere to their respective groups, where there was a significant decrease in the number non-compromised neurons following ACA in the CA1 region and RH of the subiculum (*p<0.05; Sham n = 6 and ACA n = 5).

