
Fig 1. Baseline corrected absorption spectra, normalized using the Amide I peak, for all five classes of cells observed in the study.
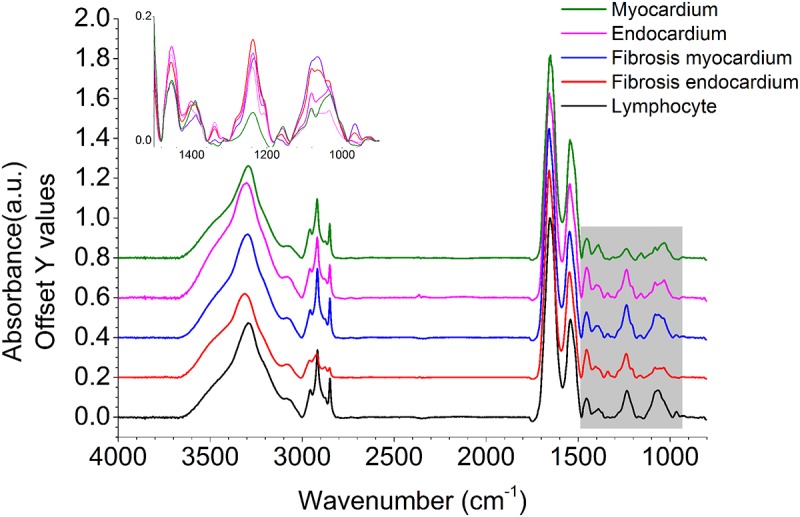
Important spectral differences observed over the fingerprint spectral region (1500–900 cm-1) are highlighted in grey and zoomed in without offset.