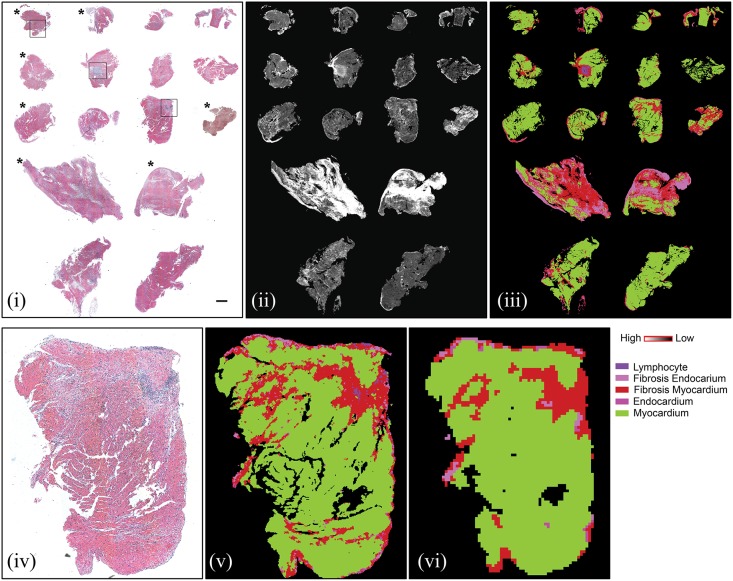
Fig 4. Biopsy section array of 16 samples used for validation.
Top panel: (i) H&E stained image of sections (scale bar represents 500μm); Asterisk marked samples showed no rejection in pathologist review. (ii) absorbance at 1236 cm-1 demonstrating differences between samples and different cell types; (iii) Classified IR image showing color coded pixels indicating different pathological classes; Bottom panel: Magnified view of one sample from validation set with matched lower spatial resolution IR image. (iv) H&E stained image of section; (v) Classified 6.25 μm x 6.25 μm pixel size IR image; (vi) Classified 25 μm x 25 μm pixel image.

