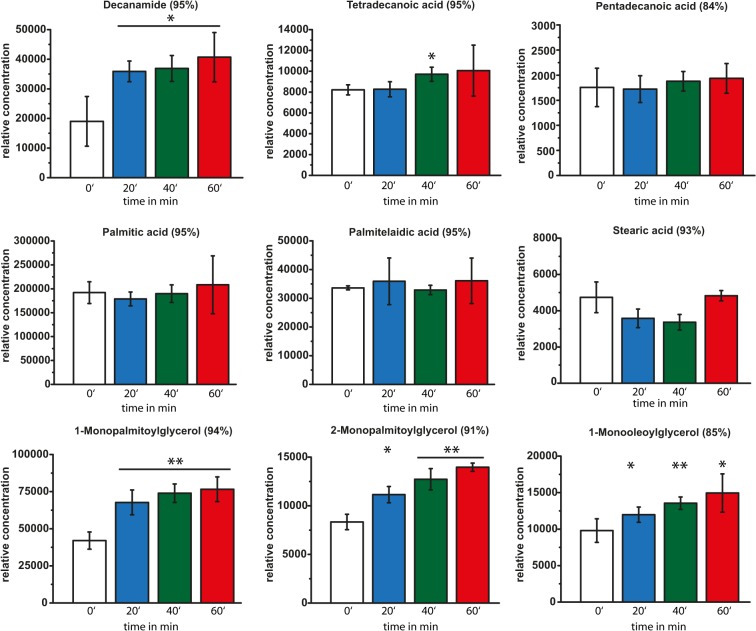
Fig 5. Time-dependent GC/MS analysis of metabolites involved in fatty acid metabolism and membrane integrity.
Relative concentrations of metabolites involved in fatty acid metabolism and membrane integrity identified by GC/MS analysis prior to HOCl stress (white bars) and in cells treated with 50 μM HOCl for 20 min (blue bars), 40 min (green bars), and 60 min (red bars). Concentrations are normalized to dry cell mass. Hit percentage of detected compounds compared with the NIST05 and NIST05s library is indicated in brackets after the compound name. Statistical significances are indicated as asterisks determined by Student’s t-test: *p < P<0.05; **p < P<0.01; and ***p < P<0.001. Shown is the mean ± standard deviation (n ≥ 3).

