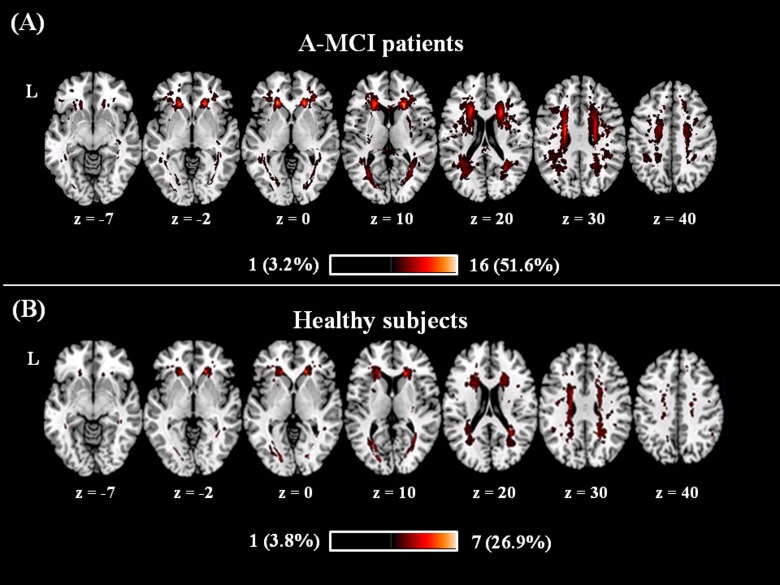
Fig 2. Lesions frequency distribution map in patients (A) and controls (B).
Colours represent number of subjects with a lesion to a specific voxel. Warmer areas indicate areas of greater lesion overlap. The anatomical distribution of T2-hyperintense white matter lesions was similar between amnestic mild cognitive impairment (a-MCI) patients (panel A) and controls (panel B). The between-group difference in T2-lesion volumes was not statistically significant, although it was on average slightly larger in the patient group (see also Table 1).

