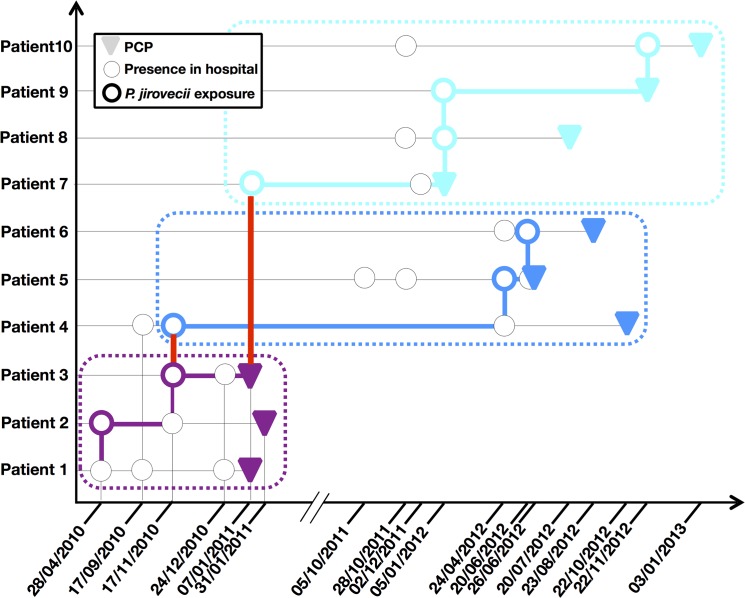
Fig 3. Transmission map of the 10 patients in whom the P. jirovecii genotype 21 was detected.
The date corresponds to the time at which the patient was present in the hospital and is delineated as a circle. Colored circles show P. jirovecii exposure of a given patient on a given day. Color coding distinguishes the different groups of patients (purple for patients 01–03, blue for patients 04–06 and turquoise for patients 07–10). The red bar corresponds to transmission between two groups of patients. Colored bars show the transmission routes.

