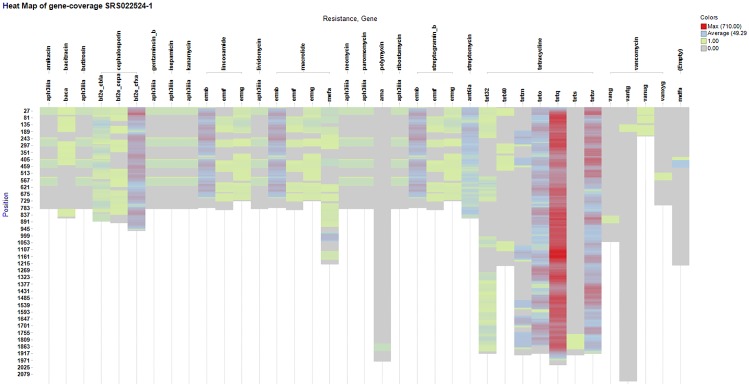
Fig 4. TreeSeq results of metagenomic stool dataset.
This is a heat map of the results generated by TreeSeq of the metagenomic stool dataset (SRS022524.1). On the x-axis the found resistance gene classes and the antibiotic that it confers resistance to. It is possible to increase the search result resolution by adding the specific gene level, which is not displayed. The y-axis shows the nucleotide positions of the gene and therefore the length of the bar also represents the length of the gene. The colour represents the amount of occurrences (hits) of a gene on this specific position.

