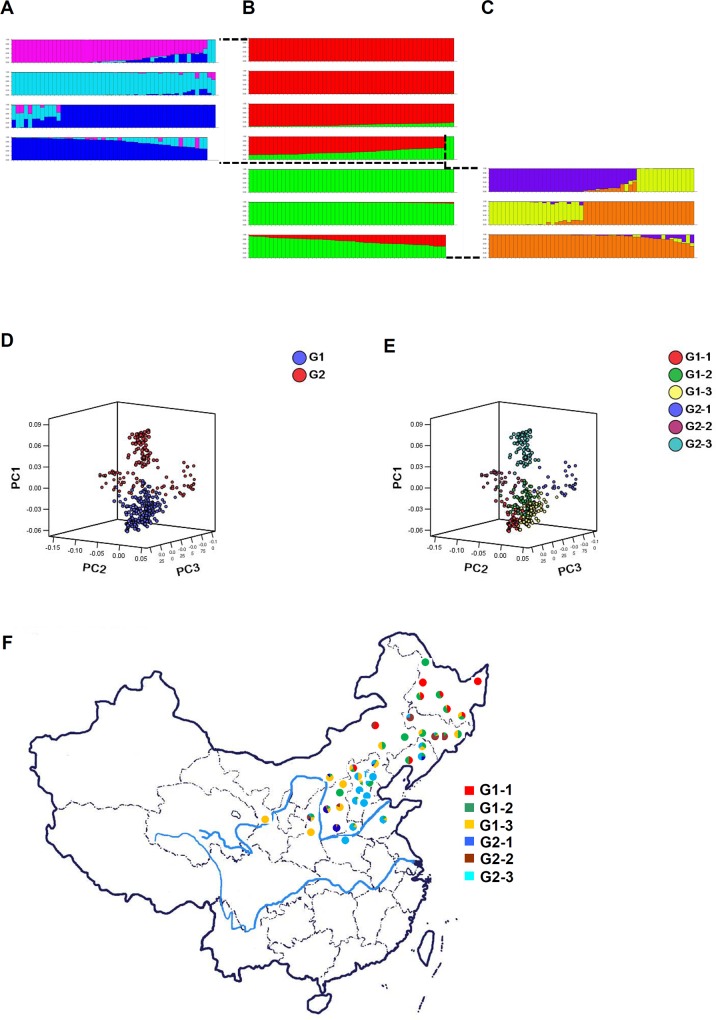
Fig 1. Inferred population structure of improved varieties.
(A)—(C): Summary plot of estimates of Q. (A) Subclusters of group2 accessions; (B) Two groups inferred in this trial; (C) Subclusters of group1 accessions; (D) Differentiation of genotypes from clusters according to the first three principal components derived from 77 SSR markers diversity analysis; (E) Substructure within each main cluster inferred by STRUCTURE; (F) Distribution of the number of varieties allocated as respective designated subclusters within each province in North China.

