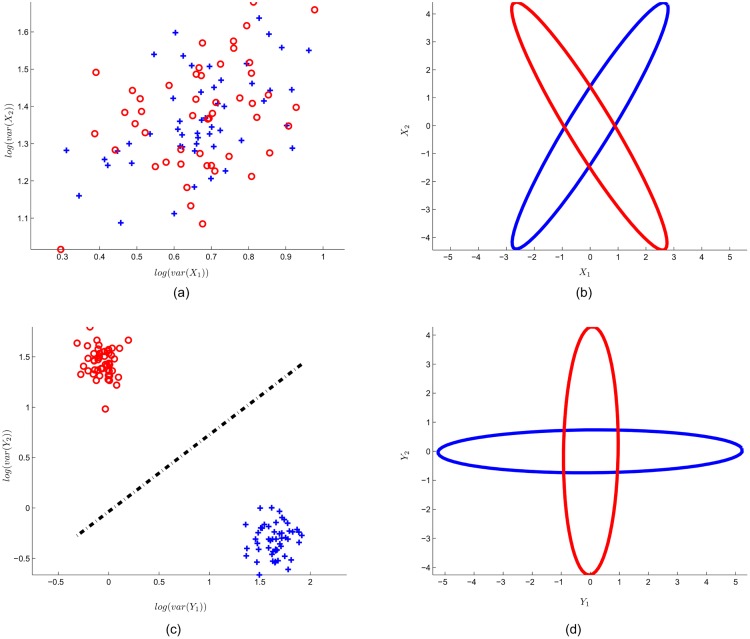
Fig 4. Input data and SFN output data for toy data with 2 classes.
(a) log-variance feature for 2-dimensional input data. Note that each point represents an epoch that belongs to class 1 (red circle) or class 2 (blue plus). (b) Enclosing ellipses represent the input data. (c) SFN spatial filter layer output (f) with generated class border (black dashed line) of the classifier layer. (d) Enclosing ellipses represent the spatially filtered input data (y).

