Figure 1.
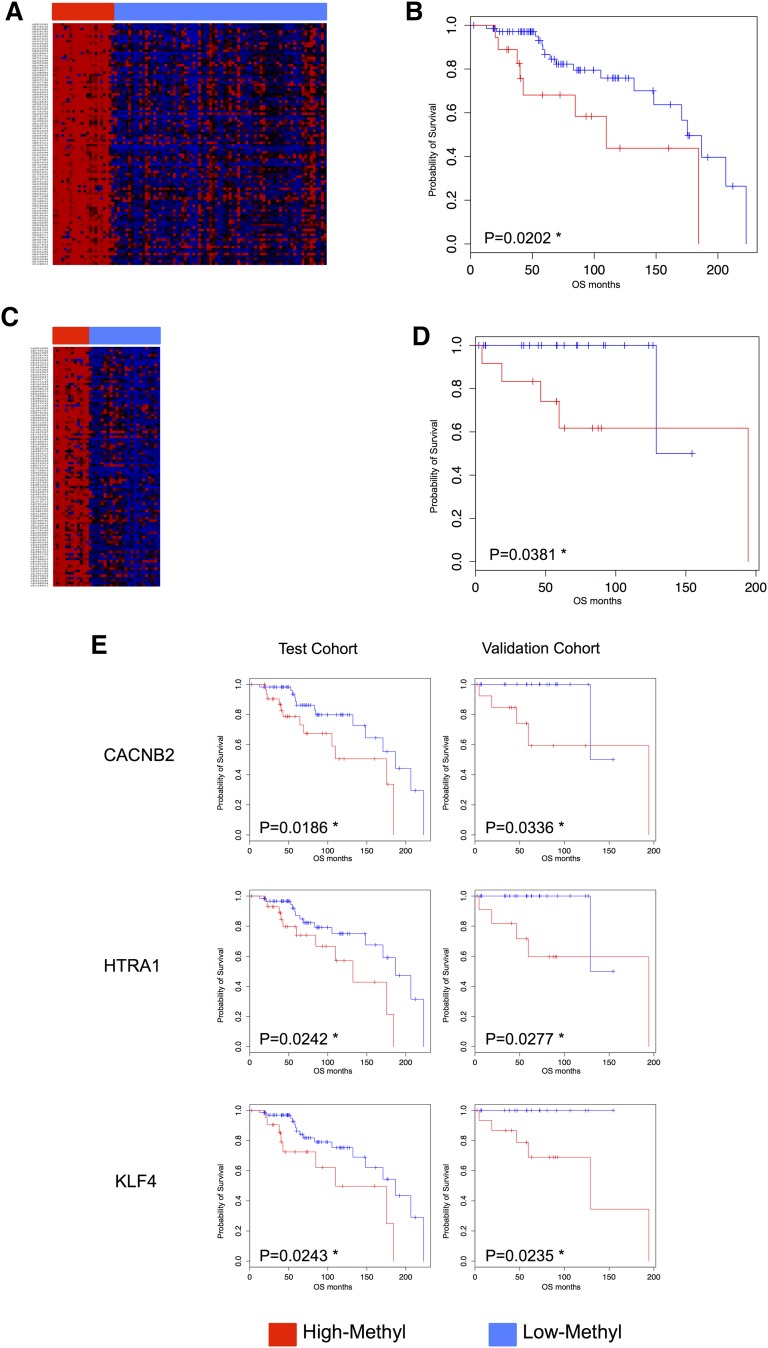
DNA methylation profiling identifies subgroups of SMZL patients with different clinical outcome. (A) Heat map for test series using 100 top-ranked probes by standard deviation (TOP-100). Unsupervised clustering analysis (Euclidean distance, complete linkage method) using the TOP-100 probes identified 2 main clusters: High-M (red) had a significantly poorer overall survival (OS) (B) than the Low-M cases (blue). (C) Heat map in an independent validation cohort of 36 SMZL patients using TOP-100; an unsupervised clustering (Euclidean distance, complete linkage method) identified again 2 clusters: 1 cluster showed High-M phenotype (red) and an inferior OS (D). (E) Kaplan-Meier log-rank curves for CACNB2 (cg01805540), HTRA1 (cg25920792), and KLF4 (cg07309102) genes in both the test and the validation cohorts. The 3 genes were significantly associated with OS in both cohorts. Red, High-M phenotype; blue, Low-M phenotype; *P < .05.

