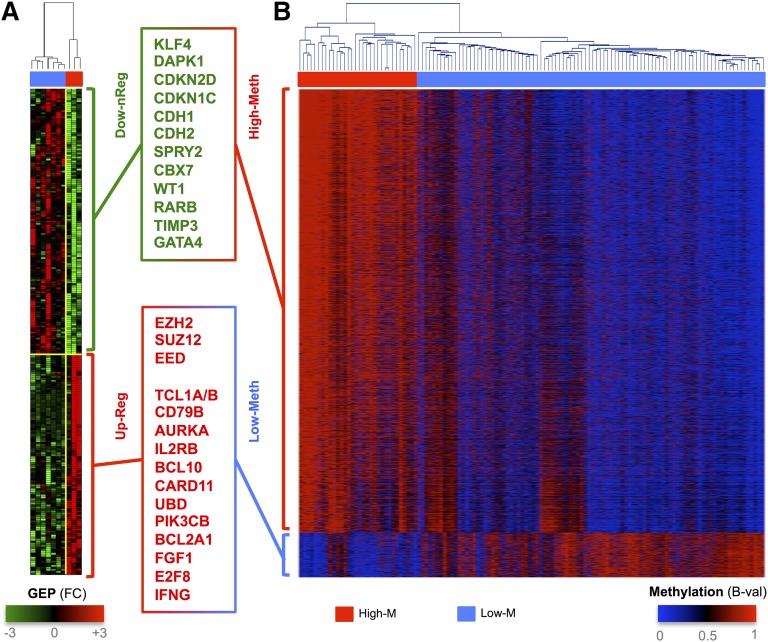
Figure 2.
Integration of methylation profiling and gene expression. Hierarchical clustering (Euclidean distance, complete linkage method) of genes with FDR <0.05 in either limma Student t test comparing High-M vs Low-M for GE (A) and methylation (B) profiling. Red and blue represent higher and lower methylation (heat map on the right), respectively, and red and green represent high- and low-level expression (heat map on the left), respectively.

