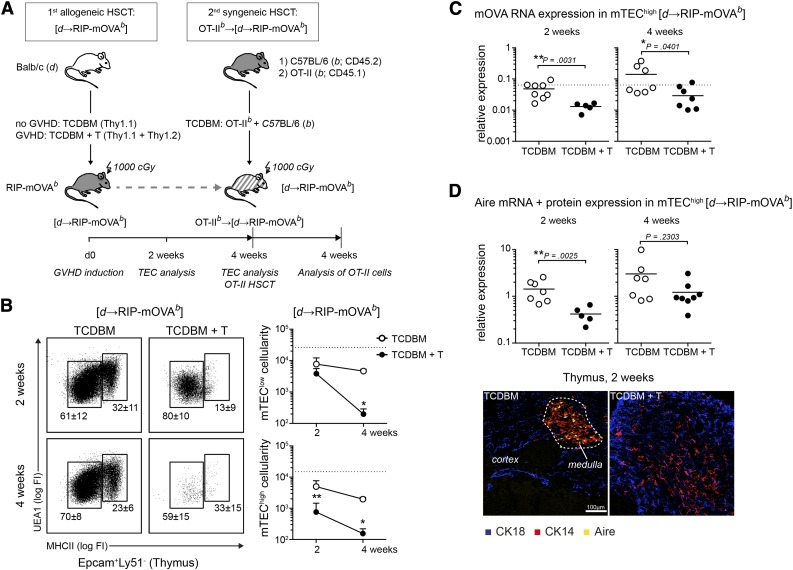
Figure 1.
Acute GVHD reduces thymic ectopic expression of the surrogate self-antigen OVA in RIP-mOVA recipients. The mTEC compartment was analyzed in a transgenic murine model of H-2d→H-2b allo-HSCT. (A). Acute GVHD was induced in 8-week-old, lethally irradiated RIP-mOVA recipients by transfer of TCDBM mixed with Thy1.2+ splenic T-cells from Balb/c donors (TCDBM + T group). This alloHSCT setting was designated as [d→RIP-mOVAb]. As controls without aGVHD, mice received Balb/c-Thy1.1+ TCDBM only (TCDBM group). Four weeks after the first alloHSCT, [d→RIP-mOVAb] mice were lethally reirradiated and retransplanted in a second syngeneic HSCT with H-2b TCDBM from CD45.1+ OT-II mice mixed at a 1:4 ratio with cells from wild-type CD45.2+ C57BL/6 mice (H-2b). This approach generated OT-IIb→[d→RIP-mOVAb] chimeric mice. (B) Flow cytometry analysis for identification of Epcam+Ly51− mTEClow and mTEChigh cells in [d→RIP-mOVAb] mice in the absence (TCDBM group; ○) and presence (TCDBM + T group; ●) of aGVHD at 2 and 4 weeks after the first alloHSCT. The numbers shown in each flow cytometry dot plot represent frequencies (%, mean ± standard deviation [SD]) of the respective population among total mTEC. Line graphs depict absolute cell numbers of mTEClow and mTEChigh. The figure represents data from 3 independent experiments with ≥3 mice per group analyzed. *P < .05, Mann-Whitney U test. (C) Expression of mOVA mRNA was determined by quantitative polymerase chain reaction in mTEChigh, which was purified from the total residual TEC pools isolated from mice with (●) or without (○) aGVHD at 2 and 4 weeks after the first alloHSCT. Expression is shown as relative expression normalized to GAPDH. Dashed lines indicate normal mOVA mRNA expression in naïve untransplanted RIP-mOVA mice. *P < .05, Mann-Whitney U test. (D) Expression of Aire mRNA was analyzed in purified mTEChigh cells in the alloHSCT groups above. Aire expression is shown as relative expression normalized to GAPDH. *P < .05, Mann-Whitney U test. To detect Aire protein, immunohistochemistry and confocal microscope analysis was performed on thymic frozen sections taken from [d→RIP-mOVAb] mice with or without aGVHD (2 weeks). Cytokeratin-18 (CK18, blue) and CD14-positive cells (red) define cortical thymic epithelial cells (cTEC) and mTEC, respectively. Aire+ cells are shown in yellow and localize to the thymus medulla. Thymic architecture and Aire are lost during aGVHD (lower right panel).

