Figure 4.
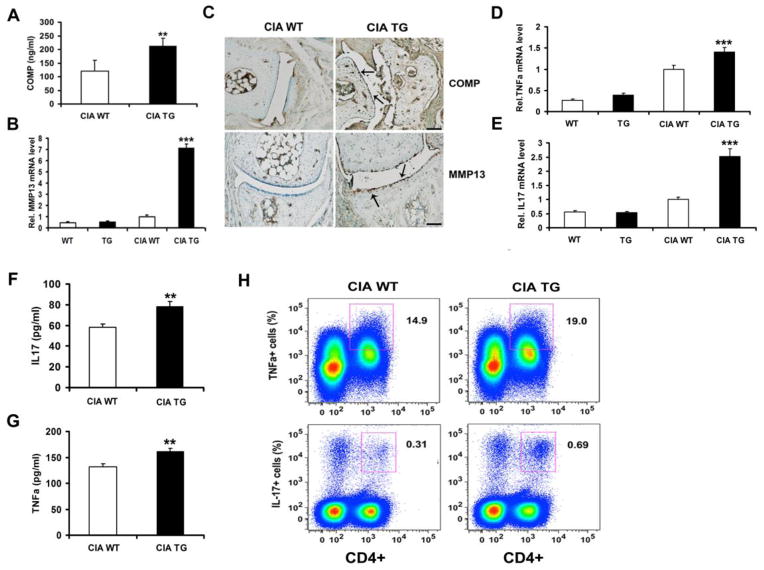
Changes of COMP fragments, MMP13 and inflammatory cytokines level in arthritic TG mice. (A) Sandwich ELISA was performed to examine the concentration of COMP fragments in serum. (B) Real-time PCR analysis of MMP13 mRNA expression. (C) Representative IHC sections of hindpaws joints. Scale bars, 50μm. (D) Real-time PCR analysis of TNF-α mRNA expression. (E) Real-time PCR analysis of IL-17 mRNA expression. (F and G) ELISA was performed to examine the levels of IL-17 and TNF-α in serum. (H) Intracellular FACS staining of TNF-α and IL-17 in draining lymph node cells. All data represent three independent results. *P < 0.05, **P<0.01.

