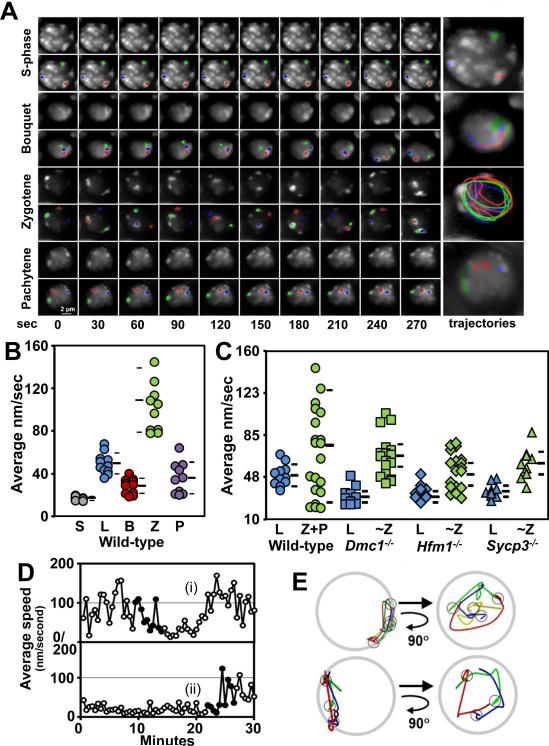
Figure 2. RPMs are Regulated by Meiotic Progression and Affected in Recombination Mutants.
A. Maximum-intensity projections of time-lapse images of wild-type prophase nuclei. Magnification bar represents 2μm. B. Quantitation of the movement of spots for wild-type premeiotic S-phase (S), leptotene (L), bouquet (B), zygotene (Z), and pachytene (P) spermatocytes. Each circle represents the average of all spots analyzed in a single spermatocyte; horizontal lines indicate the median and standard deviation values. C. Quantitation of spot movements for wild-type and recombination and synapsis mutants. Each symbol represents the average of all spots analyzed in a single spermatocyte; horizontal lines indicate the median and standard deviation values. D. Plot of average speed changes during bouquet formation and resolution in wild-type zygotene nuclei. The duration of the bouquet for cell (i) was ~8 min and >22 min for cell (ii). In panel D, filled dots indicate the periods that are shown as marker traces in E where the cells enter (i) and exit (ii) the bouquet stage. E. Traces of spot movements for the periods shown in D. The small circles mark the spot positions when they were in the bouquet stage, i.e., at the end of the trace (top panel) and the beginning of the trace (bottom panel). Each nucleus is viewed as in the original movie (top diagrams) and was then rotated to show the view down the arrows i.e., from the center of the nucleus towards the bouquet cluster (bottom diagrams). The latter views demonstrate that the bouquet clusters lie on the axes of the clockwise rotations. See also Figure S1.

