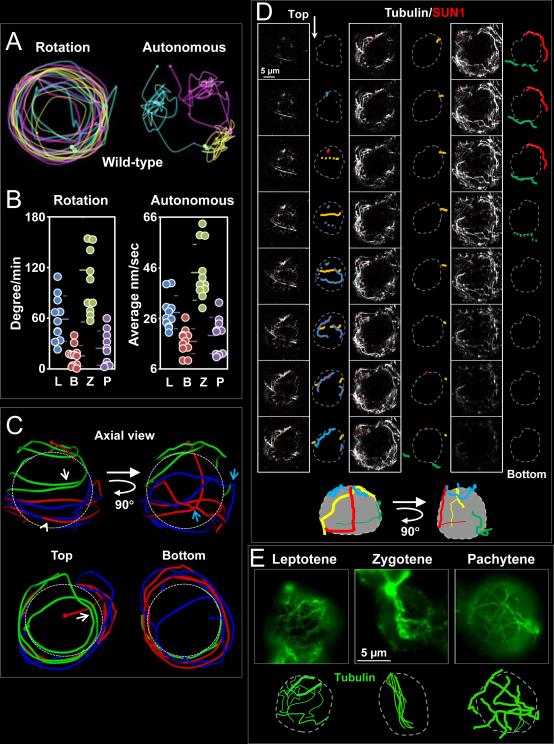
Figure 3. Identification of a Cytoplasmic Microtubule Network with Defined Stationary Tracks Associated with the Nuclear Envelope.
A. RPMs appear to be composed of nuclear rotation and independent chromosome movements. The positions and trajectories of three individual heterochromatin spots in wild-type zygotene nuclei are marked in different colors with a small sphere indicating the initial position and a large sphere indicating the final position. Rotation (left panel) and autonomous (right panel) movements of individual markers were detected in the same nucleus. B. Quantification of autonomous and rotational movements. For all datasets, the mean and standard deviation values are indicated by horizontal lines. Autonomous movements during each stage were significantly different to that of the neighboring stage (all p < 0.0001), except for the comparison of leptotene and pachytene (p = 0.11). Rotational movements in zygotene were significantly different to that of all other stages (all p < 0.03). C. Trajectory of three heterochromatin independent spots in a zygotene spermatocyte nucleus. D. Microtubule cables and their relationship with the nuclear envelope. Consecutive optical sections (0.24 μm) spanning an entire fixed squashed spermatocyte nucleus reveal a complex microtubule cable network arrangement in 3D. The nuclear envelope defined by SUN1 localization is represented by a grey dotted line and microtubules (outlined in colors) are followed through successive sections. The schematic representations (bottom) represent 3D reconstructions of microtubule cable disposition along the nucleus. Magnification bar represents 5μm. E. Single slice image of wild-type spermatocytes at different stages of prophase immunostained using anti α-tubulin antibodies. The cartoons are schematic representations of the representative microtubule patterns at each stage. Magnification bar represents 5μm. See also Figure S1. See also Figure S2.

