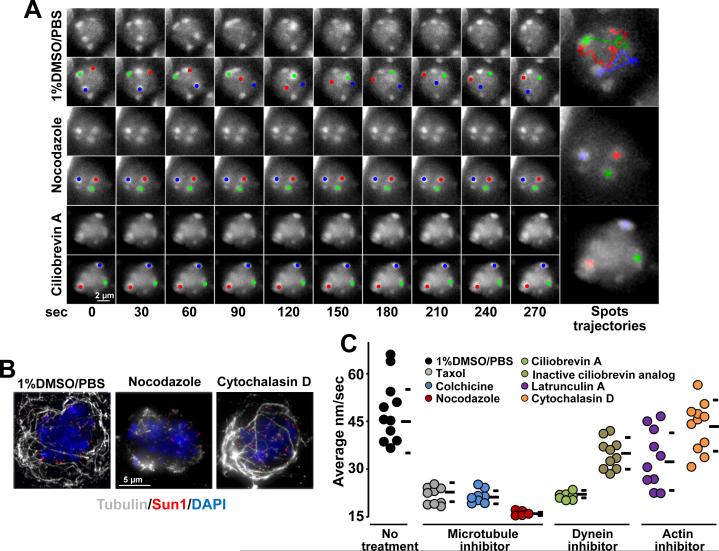
Figure 4. RPMs are Dependent on Microtubules and dynein.
A. Maximum-intensity projections of time-lapse images of wild-type zygotene spermatocytes after the indicated treatments. Magnification bar represents 2μm.B. Maximum-intensity projections of representative pachytene spermatocytes immunostained for α-tubulin and SUN1 after the indicated treatments. Magnification bar represents 5μm.C. Quantitation of RPMs in zygotene spermatocytes after intraperitoneal injection of 1% DMSO or microtubule, dynein or actin inhibitors; horizontal lines indicate the median and standard deviation values. See also Figure S3.

