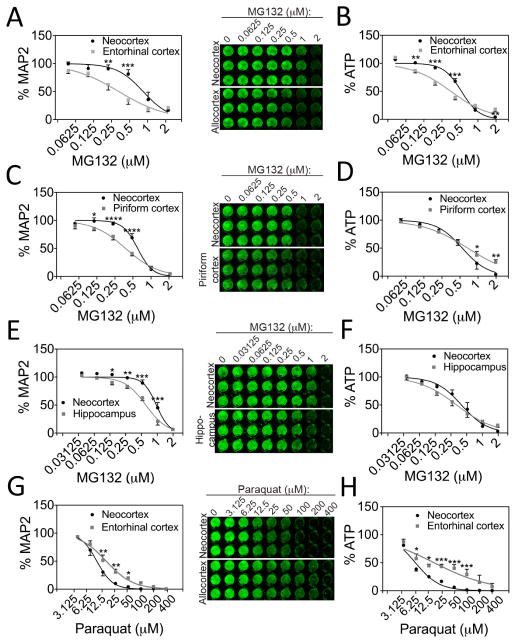
Figure 2. Regional differences in vulnerability to cellular stress.
MAP2 content (A, C, E, G) and ATP levels (B, D, F, H) in neocortex cultures and cultures harvested from entorhinal, piriform, and hippocampal allocortex 48h after treatment with the proteasome inhibitor MG132 or the oxidative toxin paraquat. Fitted curves were extrapolated from non-linear regression analyses after conversion of the X-axis to a log scale. MAP2 and ATP levels at 0 μM MG132 were set to 100% (not shown in log scale graphs). For ease of presentation, concentrations of MG132 are listed in micromolar units rather than in log units on the X-axis. Neocortical neurons were more resistant to proteotoxic stress from MG132 than neurons from three allocortical subregions according to the MAP2 assay, but less resistant to oxidative stress from paraquat. The ATP metabolic assay agreed with some, but not all of the MAP2 In-Cell Westerns. Shown are the mean ± SEM of 3–4 independent experiments. * p ≤ 0.05, ** p ≤ 0.01, *** p ≤ 0.001, **** p ≤ 0.0001 neo- vs allocortex, Bonferroni post hoc correction following two-way ANOVA.

