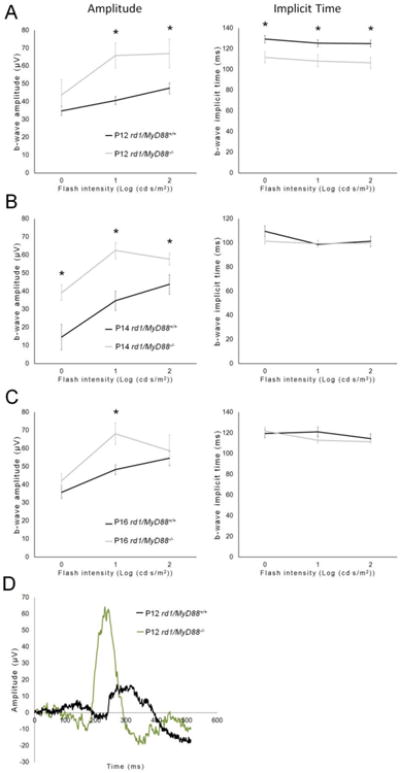
Fig. 5.

The photopic retina response is improved during retinal degeneration in rd1/MyD88-/- mice. Graphs (A-C) show the retina response to photopic (cone-driven) stimuli at different flash intensities. An improvement in retina function was demonstrated in rd1/MyD88-/- at all three time-points compared with rd1/MyD88+/+ (rd1/MyD88+/+ n=4-7, rd1/MyD88-/- n=4-10). Representative ERG waveforms for each genotype at P12 are shown in panel D. Mean ± SEM are shown. * p<0.05
