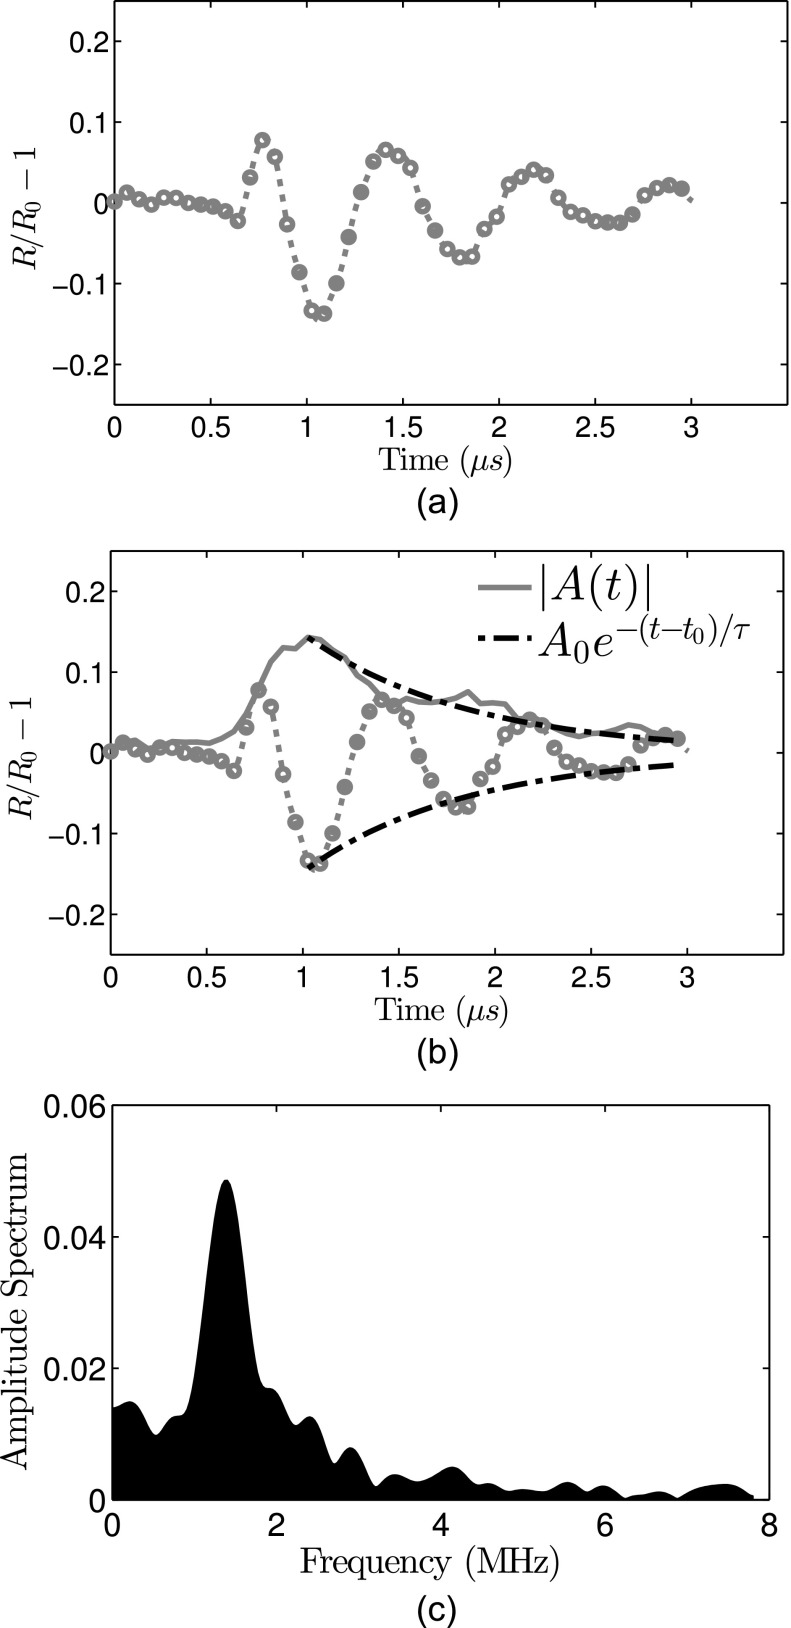
FIG. 4.
Schematic of the damping analysis. (a) Radius versus time curve measured in response to 0° impulse excitation (the response due to 180° excitation is truncated for clarity). (b) The amplitude decay envelope (solid line) is calculated using the discrete Hilbert transform. The time constant is obtained by fitting an exponential decay (dashed-dotted line) to the envelope using Eq. (1). For this example, R0 = 2.5 μm, τ = 0.85 μs, κs = 5.6 × 10⁻⁹ kg/s. (c) Amplitude spectrum of the radius versus time curve.

