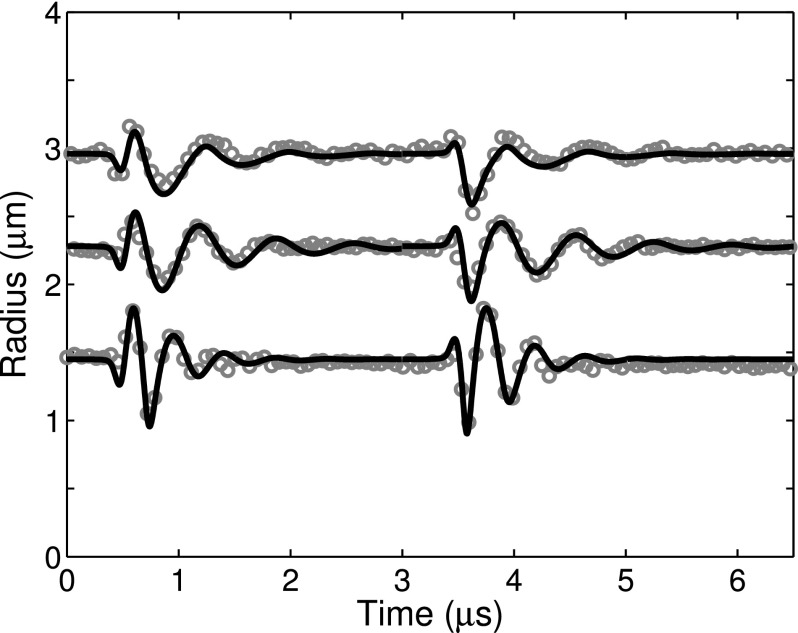
FIG. 7.
Example of simulated and experimentally measured radius versus time curves for ELIP with equilibrium radii of 1.5, 2.3, and 3.0 μm. The excitation peak pressure amplitude for all cases was 250 kPa. Estimates of the shell viscosity were derived from the experimental measurements for each case and used as inputs for the numerical simulation, yielding κs = 3.3 ± 0.4 × 10⁻⁹, 6.0 ± 0.3 × 10⁻⁹, and 2.15 ± 0.2 × 10⁻⁸ kg/s, respectively. Other simulation parameters were R0 = 1.5, 2.3, and 3.0 μm and χ = 0.1, 0.2, and 1.55 N/m, respectively.

