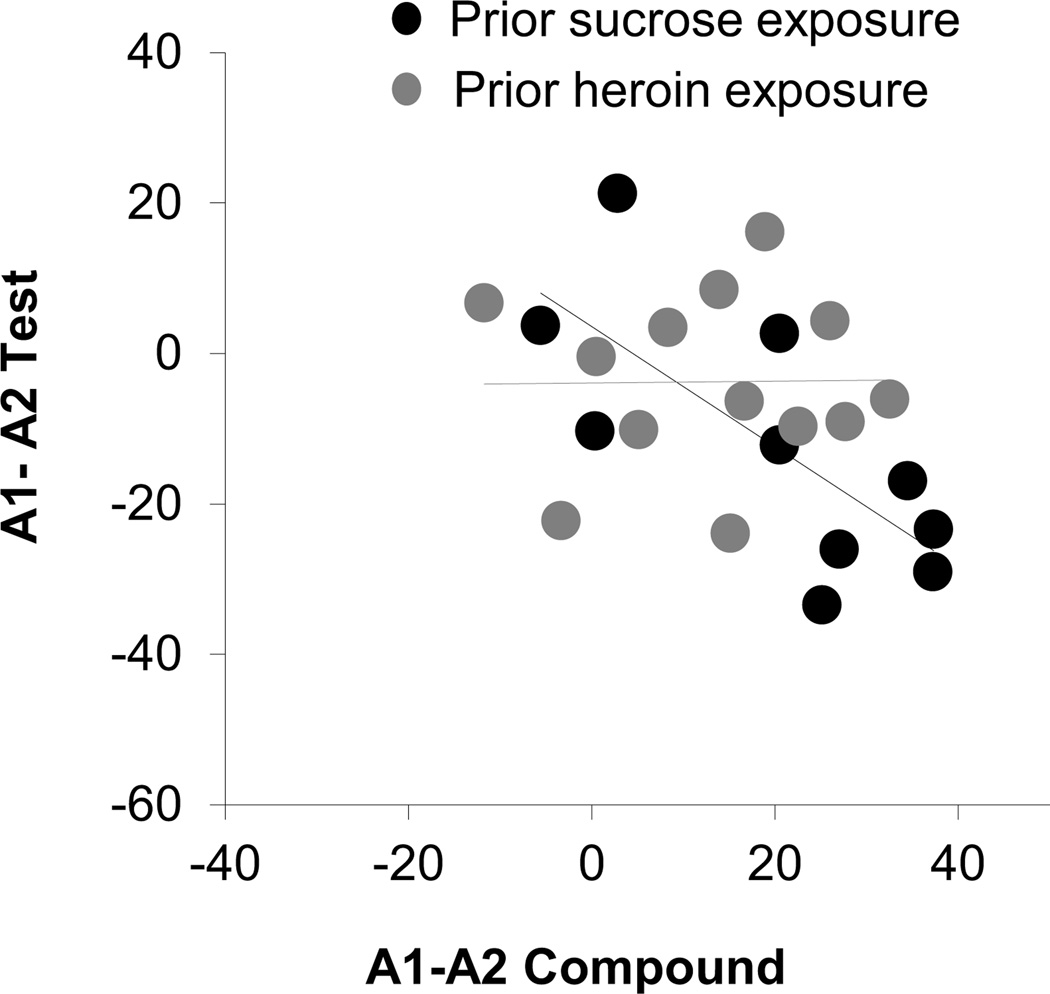
Figure 6. Correlations between summation at the start of compound training and extinction of responding to the over-expected cue at the start of the probe test.
Scatter plot shows the relationship between the difference in conditioned responding to A1 and A2 on the first trial of compound and extinction training. Black and grey circles represent sucrose and heroin groups respectively. Compound and test scores were correlated in sucrose (r=−0.73, p<0.05) but not heroin-trained (r=0.01, p>0.05) rats.

