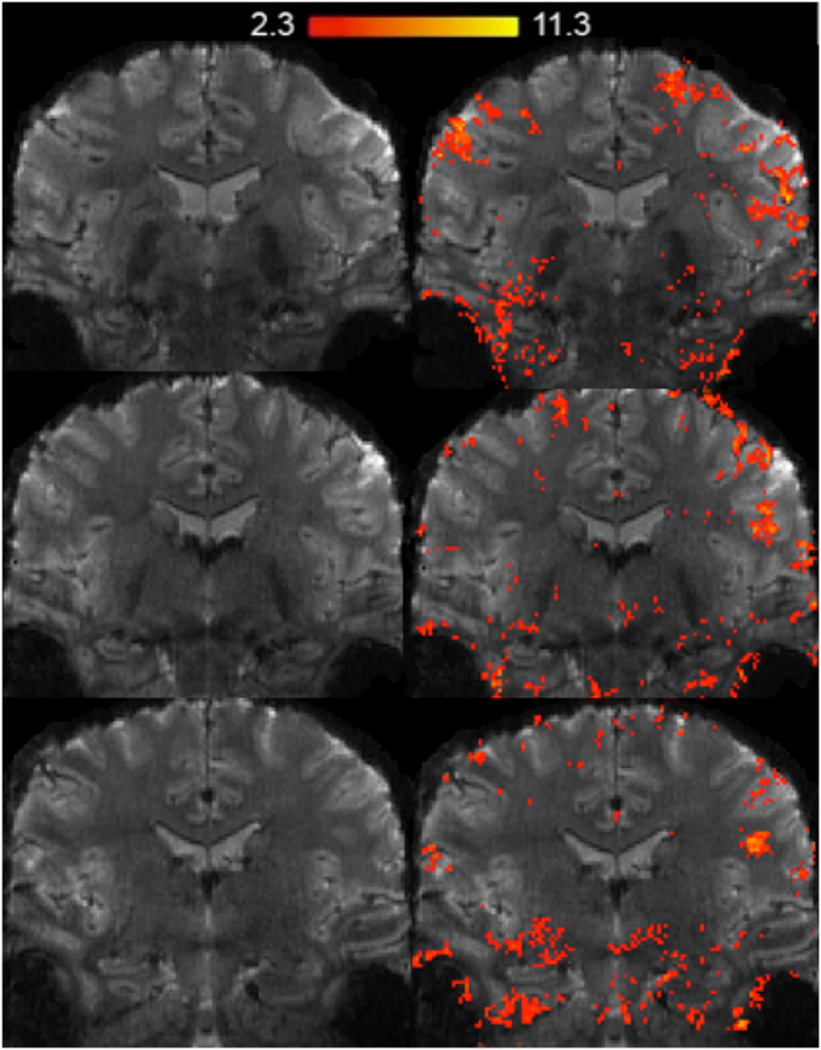
Fig. 8. fMRI example data.
An example subject’s activation map superimposed on an oblique-coronal high-resolution fMRI image during the learning and recall of paired associates compared to baseline. Shown are clusters of significantly activated regions (statistical maps of significantly activated regions; z ≥ 2.4, p < 0.05 corrected).

