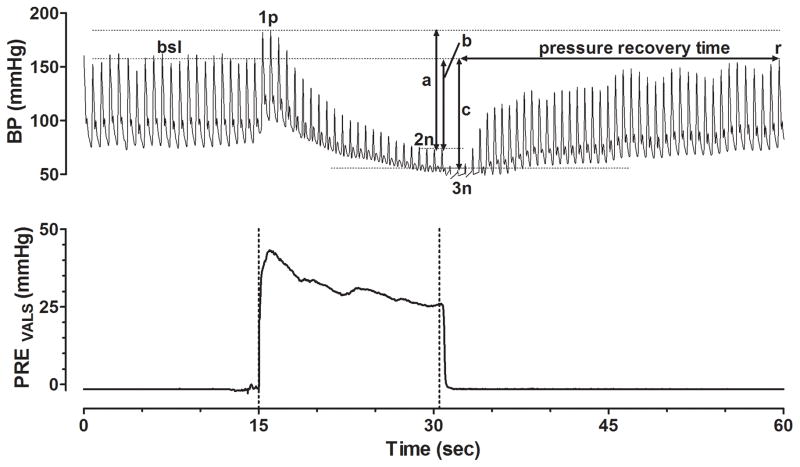
Figure 2. Schematic Parameterization of the Valsalva Maneuver.
Valsalva maneuver from one of our orthostatic hypotension patients is shown with blood pressure displayed on top and expiratory Valsalva pressure on the bottom. Annotations include the baseline (bsl) systolic blood pressure (SBP) prior to the Valsalva maneuver, the peak SBP during Valsalva phase 1 (1p), the nadir of Valsalva phase 2 (2n), and the nadir of phase 3 (3n). Arrow (a) represents the Valsalva phase 2 SBP Decrement. Arrow (b) represents the difference between baseline SBP and the end of Valsalva phase 2n. Arrow (c) represents the difference between baseline SBP and point 3n. Pressure recovery time (PRT) is measured as the time from the nadir SBP of Valsalva phase 3 until SBP recovers back to bsl level at point (r). Adrenergic baroreflex sensitivity index (BRS-a) is equal to the SBP represented by arrow (c) divided by the PRT.

