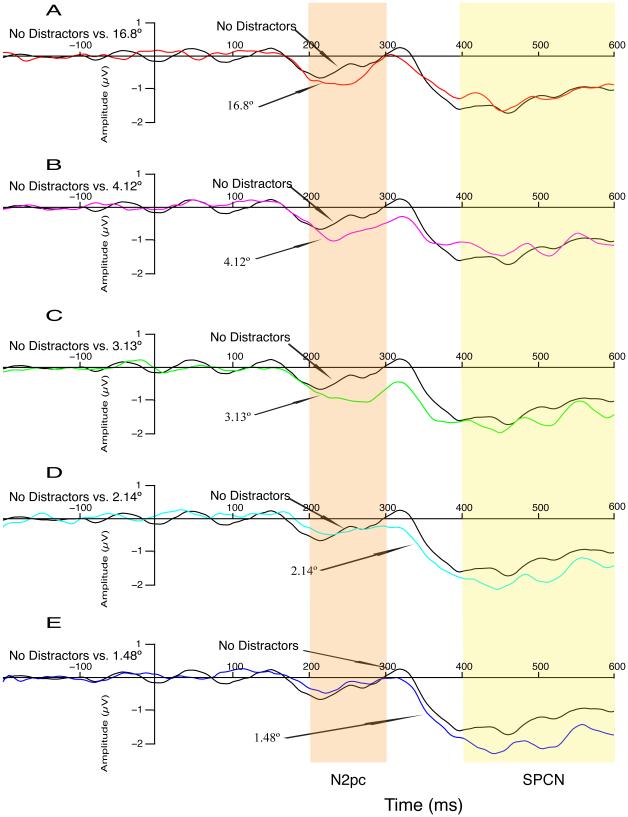
Figure 8.
Grand average difference waveforms (contralateral minus ipsilateral relative to the side containing the attended color) for Experiment 2. The N2pc (200 – 300 ms) and SPCN (400 – 600 ms) measurement windows are highlighted. Waveforms from the different target-distractor distances are shown in A (16.8°), B (4.12°), C (3.13°), D (2.14°), and E (1.48°). For comparison, the waveforms from the no-flanker trials are overlaid with the waveforms for each target-flanker distance.

