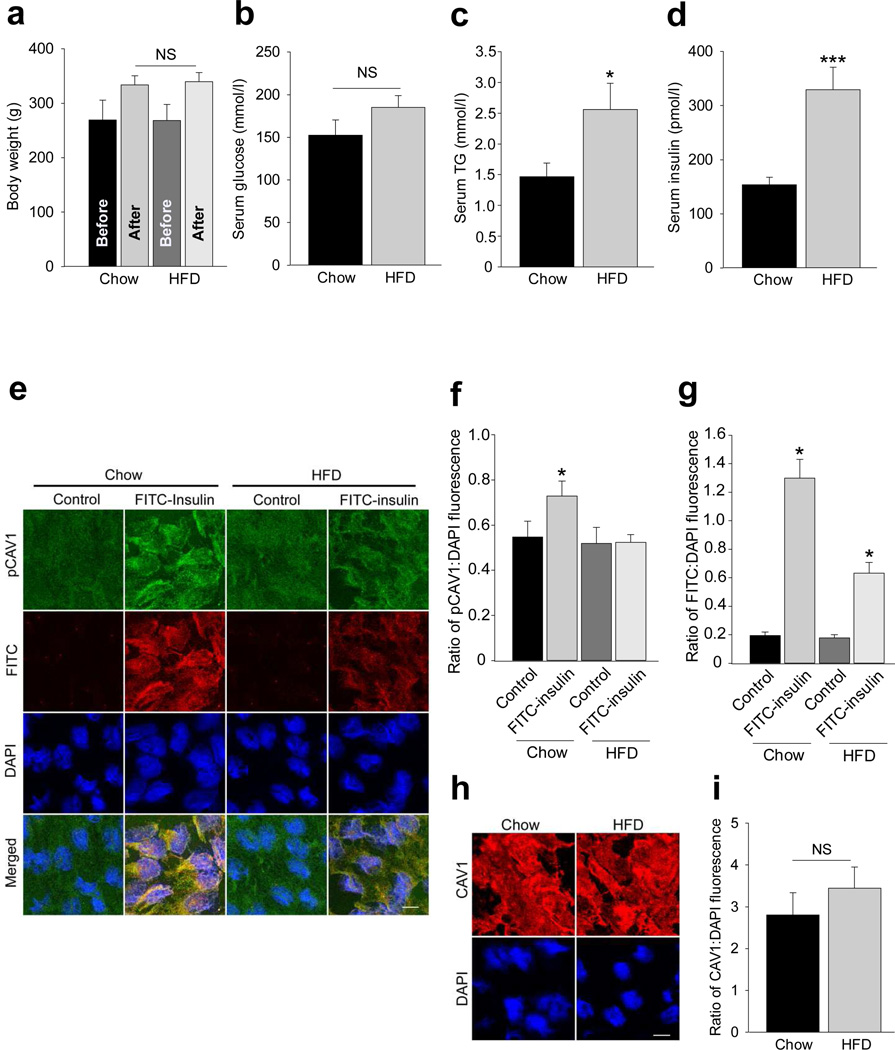
Fig. 7.
Effects of high fat feeding on endothelial caveolin-1 phosphorylation at Tyr14 and FITC-insulin uptake in rats. Rat ECs from either HFD or chow-fed rats were stained for phospho-caveolin-1 (pCAV1; green) and FITC (red). Metabolic characteristics of the rats on either HFD or regular chow diet (n=7 for each group): (a) body weight, (b) serum glucose concentration, (c) serum TG, *p<0.05 compared with the chow group; (d) serum insulin concentrations, ***p<0.001 compared with the chow group. (e) Representative confocal images. Histograms indicate quantification of (f) pCAV1 or (g) FITC-insulin. *p<0.05 compared with remaining groups (f and g). (h) Representative confocal images. (i) Histograms indicate the quantification of CAV1 (n=4 for each group). Scale bars, 10 µm

