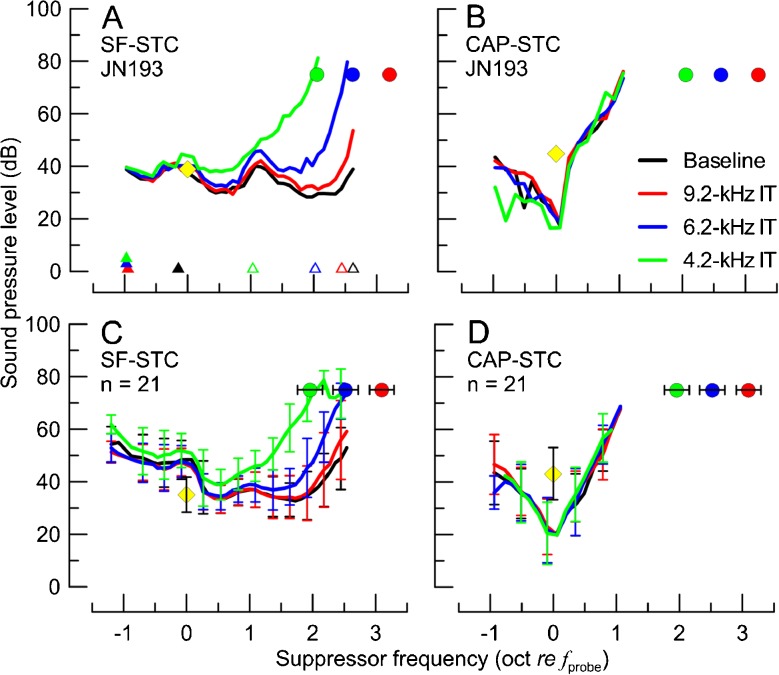
FIG. 1.
The SF-STCs and CAP-STCs obtained in the absence (black) or presence of IT at varying frequencies (red: 9.2 kHz, blue: 6.2 kHz, green: 4.2 kHz) in one animal (A, B) and averaged across 21 animals (C, D). The frequencies and levels of the probe and the IT conditions are shown with yellow diamonds and color-coded circles, respectively. The error bars correspond to ±1 standard deviation (SD; note, for the average STCs in C and D, error bars are shown for every third point to improve readability of the figure). In A, an example of determination of low-side and high-side f cor are shown with closed and open triangles (shifted vertically to avoid overlap), respectively. The probe frequency ranged from 0.93 to 1.44 kHz with an average of 1.09 kHz.

