FIG. 4.
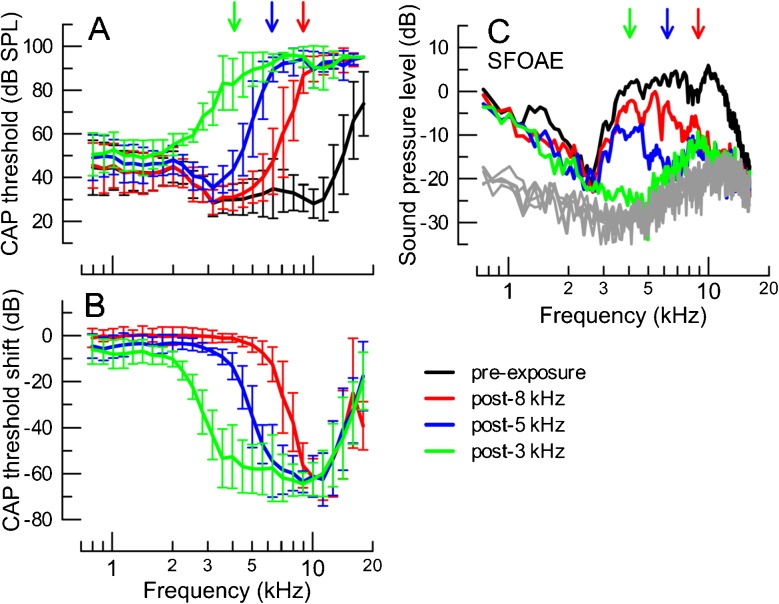
Mean CAP thresholds prior to (black) and after exposing the animals to high-intensity tones in sequence, starting with a 8-kHz tone (red), then 5-kHz (blue) and lastly 3-kHz (green) for seven animals (A). The corresponding CAP threshold shifts (pre-exposure-post-exposure) are plotted in B. The error bars correspond to ±1 SD. In C, the average SFOAE levels evoked with a 30 dB SPL probe are shown across the frequency range, pre- and post-exposures. The noise levels are shown in gray. For clarity, the error bars were omitted in C (on average, the SD was 8 dB for SFOAE levels and 6 dB for the noise). The arrows in A and C indicate the targeted frequencies at which a CAP threshold of at least 70 dB SPL was expected following a given exposure (matching colors).

