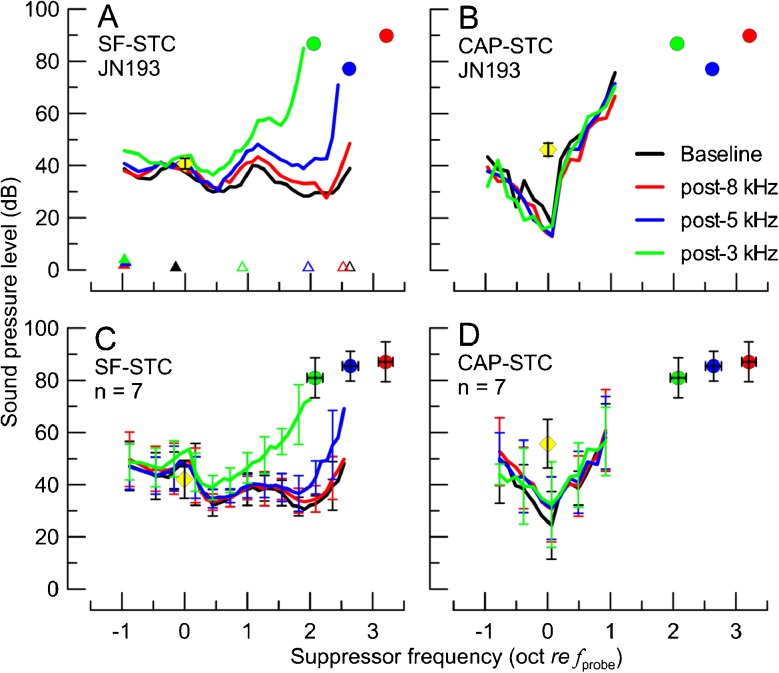
FIG. 5.
The SF-STCs and CAP-STCs obtained for the baseline condition (black) and following the exposures to 8-kHz (red), 5-kHz (blue), and 3-kHz (green) tones for the animal previously shown in Fig. 1 (A, B) and averaged across seven animals (C, D). The parameters of the probe are shown with yellow diamonds (note, for clarity, a grand average of probe levels used across all conditions is shown; individual probe levels are listed in Table 2). The probe frequency ranged from 0.93 to 1.18 kHz with an average of 1.00 kHz. The colored circles show individual (A, B) or average (C, D) CAP thresholds at frequencies corresponding to ITs for a given animal. The error bars correspond to ±1 SD (note, for the average STCs in C, D, error bars are shown for every third point to improve readability). Corner frequencies are marked with triangles in A as in Fig. 1A.

