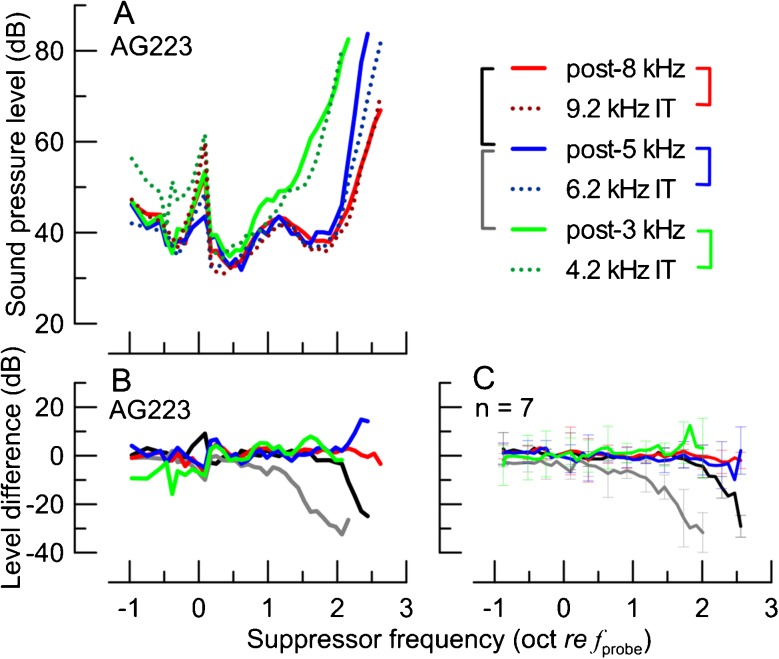
FIG. 7.
The SF-STCs obtained for animal AG223 with the ITs present (A, dotted) and following exposures to intense tones (solid; see the legend). Note the similarity between the solid and dotted curves, plotted in similar colors, despite different manipulations (IT vs. exposure) and differences in probe levels used to measure SF-STCs (see Table 2). The differences (in dB) between the suppressor level at criterion threshold between pairs of SF-STCs for animal AG223 are shown in B (pairs of SF-STCs coded in colors as shown with brackets in the legend of A). Note the lack of consistent differences between post-exposure SF-STCs paired with IT SF-STCs (colors) as compared to the large differences on the high-frequency side between pairs of post-exposure SF-STCs (black and gray). The average SF-STC level differences for seven animals are shown in C (color code as in B). The error bars show ±1 SD; note, to preserve the clarity, error bars are shown only for every third data point.

