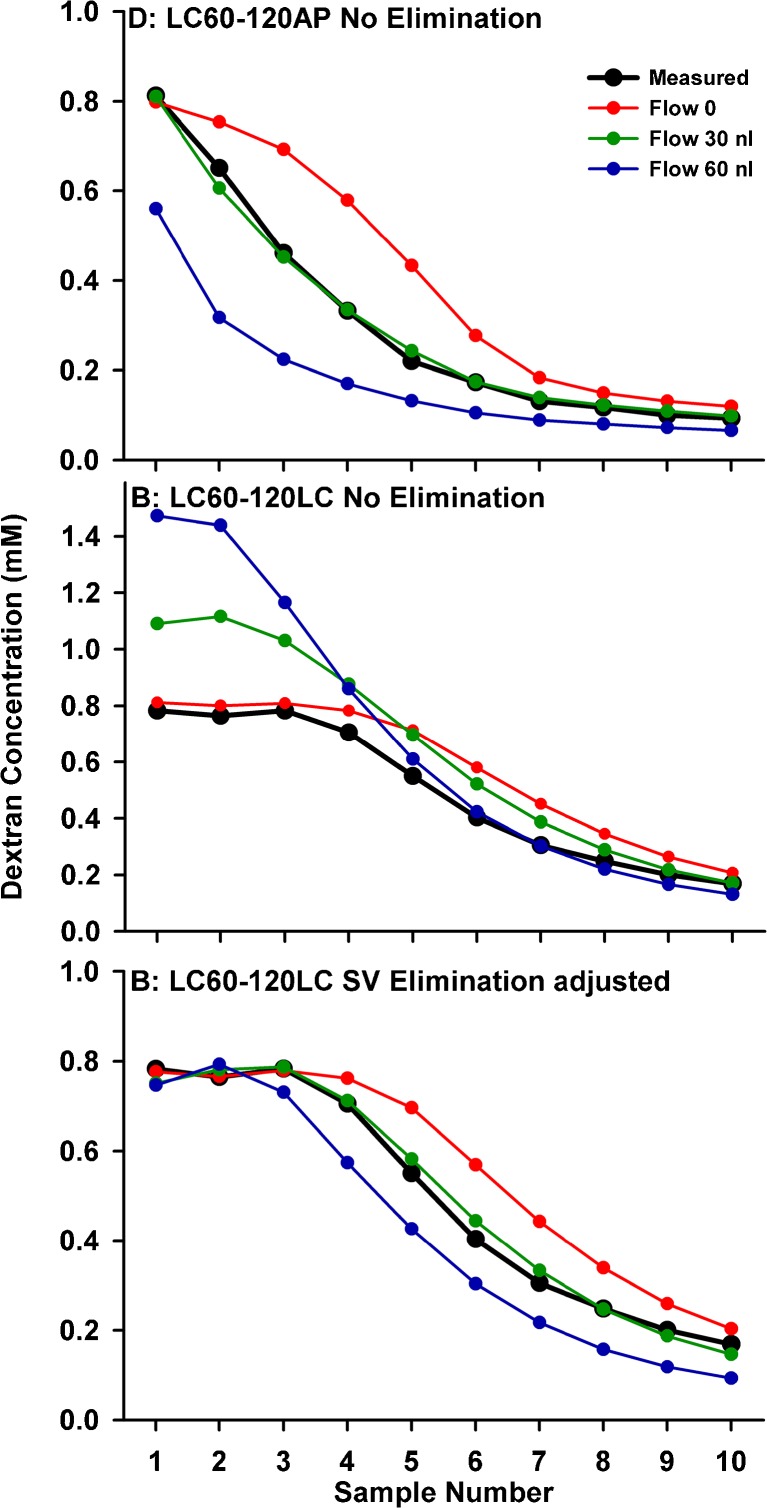
FIG. 5.
Calculated influence of volume entry at the cochlear aqueduct causing dilution at the base and apical volume flow in scala tympani. Upper, samples from the apex. Measured (black) and calculated (colored) samples for three different flow rates. A rate of ∼30 nL/min best accounts for the measured curve of samples from the apex. Middle, samples from the LSCC. The influence of perilymph flow on LSCC samples is more complex as we need to consider where volume (and associated solute) is lost. Lateral SCC samples are first calculated for a distributed volume loss, with volume flow rate progressively declining through scala vestibuli and the vestibule. If volume was lost but solute was retained, solute concentration increases would be observed as seen here, becoming more pronounced with higher flow rates. Lower, the same distributed volume loss flow algorithm, now with elimination from scala vestibuli and the vestibule with half-times of 2,000, 240, and 128 min for flow rates of 0, 30, and 60 nL/min, respectively. The combination of a distributed volume loss and a distributed loss of solute can account for the measured curves.

