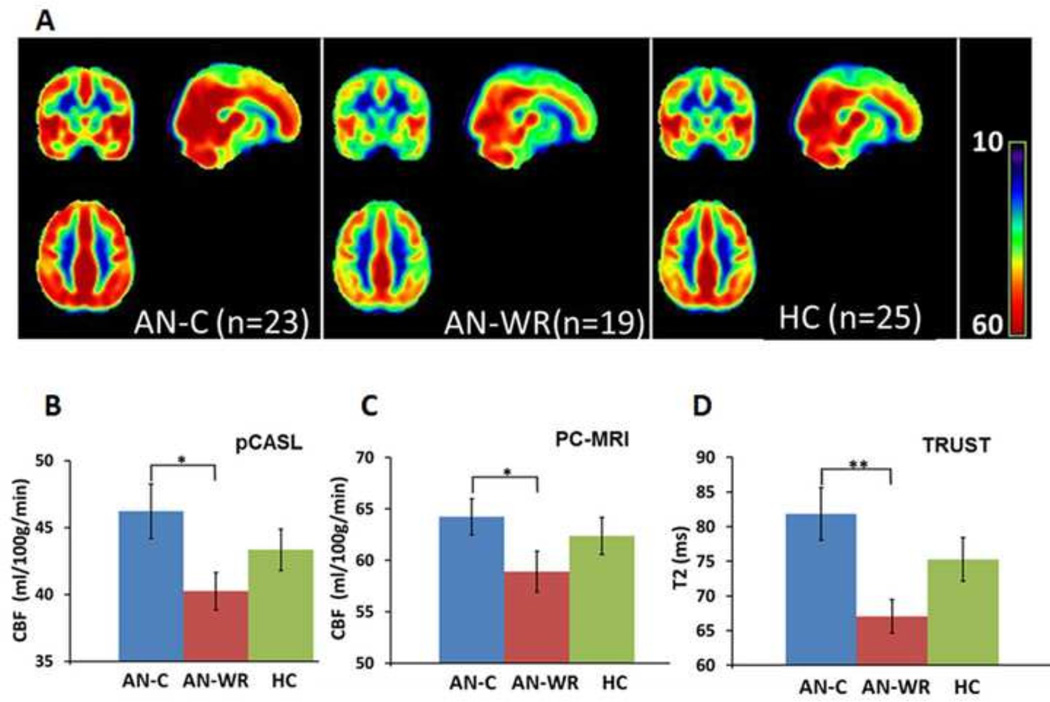
Fig. 3.
Whole-brain cerebral blood flow. A. Group-averaged CBF maps for AN-C, AN-WR, and HC groups. CBF differences are visually apparent in bilateral frontal and temporal lobes. B. Mean CBF of each group using pCASL technique. C. Mean CBF of each group using PC-MRI technique. D. Mean T2 values for each group using TRUST technique. For BCD, the AN-C mean is in blue, the AN-WR mean in red, and the HC mean in green. The error bar is the standard error of the mean. One asterisk corresponds to P ≤0.05; two asterisks indicate P<0.01.

