Fig. 5.
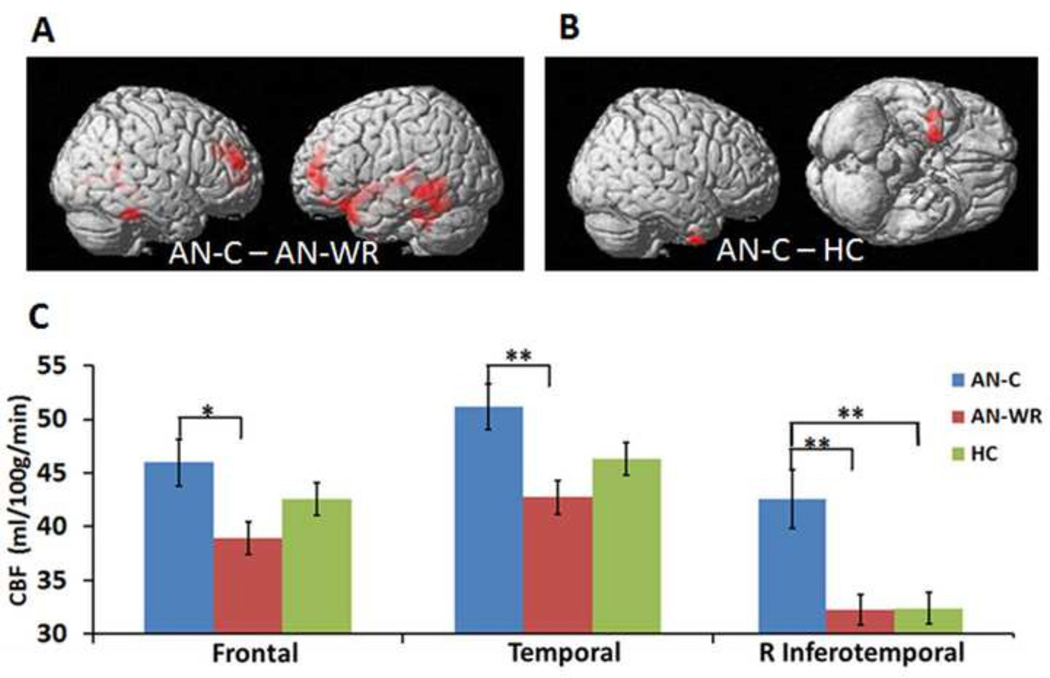
Regional cerebral blood flow. A. Whole-brain voxel-wise t-test for the AN-C and AN-WR groups. Red regions are those with significantly higher CBF in the AN-C group relative to the AN-WR; differences are primarily in the bilateral temporal and frontal lobes. B. Whole-brain voxel-wise t-test for the AN-C and HC groups. The red region in the inferotemporal cortex has significantly higher CBF in the AN-C group relative to the HC group. For both A and B, significance threshold for differences was set at cluster PFWE < 0.001. C. ROI analysis for frontal lobe, temporal lobe and right inferior temporal gyrus. The AN-C group mean is in blue, the AN-WR group mean in red, and the HC group mean in green. Error bar is the standard error of the mean. One asterisk corresponds to P ≤0.05; two asterisks indicate P<0.01.

