
Fig. 1.
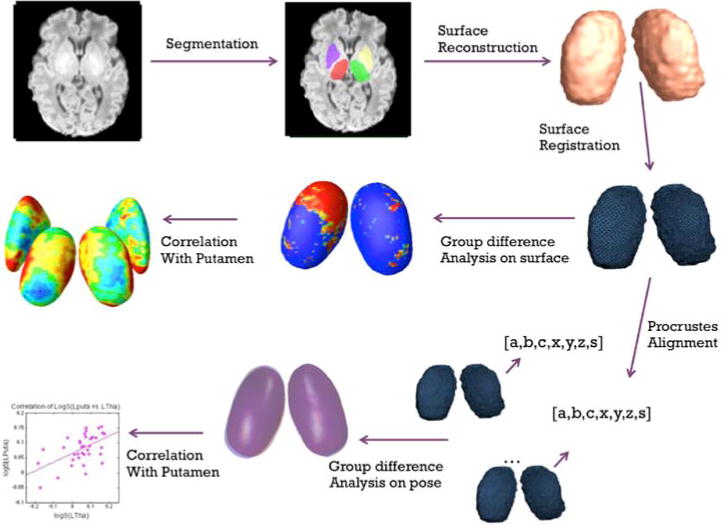
Diagram of the combined shape and relative pose analysis. For simplicity, only the surfaces of thalamus are used for illustration. Top Row: the subcortical structures are first segmented from T1 images, and then reconstructed to 3D surface models; Middle Row: surface based morphometry and correlation analysis; Bottom Row: relative pose based statistics and correlation analysis