
Fig. 6.
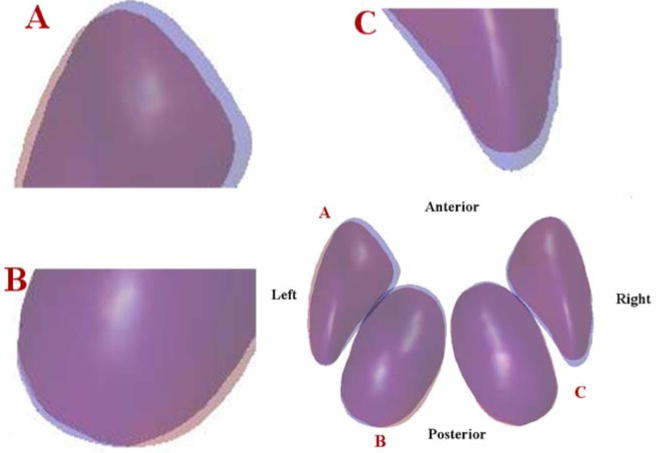
3D visualization of the pose of mean shapes averaged from the preterm (red) and term groups (blue). Areas where the mean shapes of two groups overlaid appear in purple. To better visualize the pose changes, enlargements of locations A, B, C at the bottom right figure are presented in top left, bottom left, and top right figures, respectively. Note the borders of these two structures: shift of pose are evident on the left putamen (A), left thalamus (B), and right putamen (C), but are quite small the right thalamus