
Figure 6.
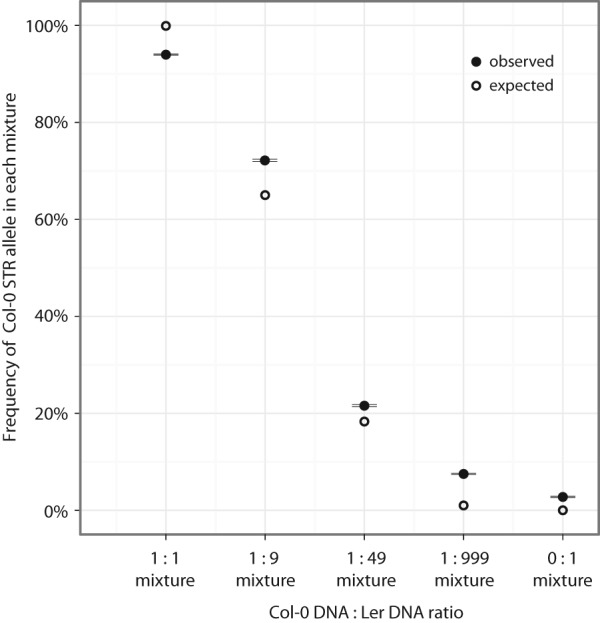
MIPSTR detects low frequency STR alleles. (x-axis) Tested mixtures of Ler and Col-0 DNA; (y-axis) probability of detecting Col-0 STR alleles; (closed circles) observed frequency of observing Col-0 STR alleles (standard error is indicated, black lines); (open circles) predicted frequency of observing Col-0 STR alleles. To calculate the observed frequency for each mixture, we resampled tag-defined read group modes supporting either the Col-0 or Ler allele at each STR locus 1000 times. The proportion of samples that carry the Col-0 allele was determined and averaged across all STR loci that differ between Ler and Col-0. To calculate the expected probability for each mixture, we assumed the known ratios of Col-0 and Ler STR alleles in each mixture and the probability of observing the Col-0 STR allele with 10 observations.