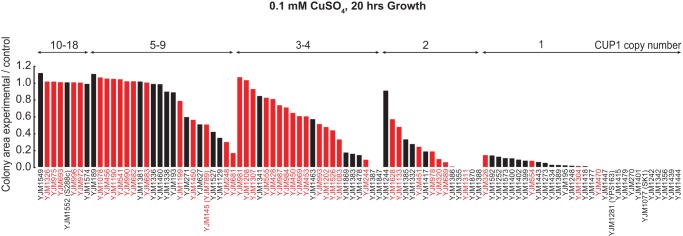
Figure 6.

Copper resistance phenotypes of the 100-genomes S. cerevisiae strains. Colony area as a measure of copper resistance in 96 S. cerevisiae strains at 0.1 mM CuSO4 concentration. Strains are arranged according to the CUP1 copy number, then to colony size. Increase in CUP1 copy number increases resistance to copper, although there are also CUP1 copy number-independent contributions. Red bars denote clinical strains and black bars denote nonclinical strains.
