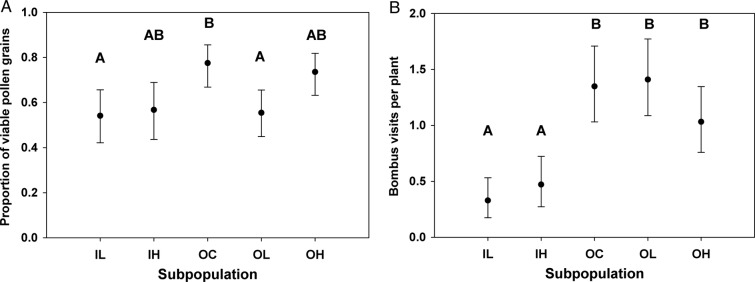
Figure 3.

(A) Mean pollen viability in the five M. guttatus subpopulations in the 2013 live plant experiment. Estimates represent least-squares means derived from a generalized mixed model, back transformed from the odds ratios. Error bars indicate 95 % confidence intervals. Means with different letters are significantly different based on a Tukey–Kramer test. (B) Mean B. impatiens visits per plant per day in the five subpopulations in the 2013 live plant experiment. Estimates represent least-squares means derived from a mixed model ANCOVA. Error bars indicate 95 % confidence intervals. Means with different letters are significantly different based on a Tukey–Kramer test.
