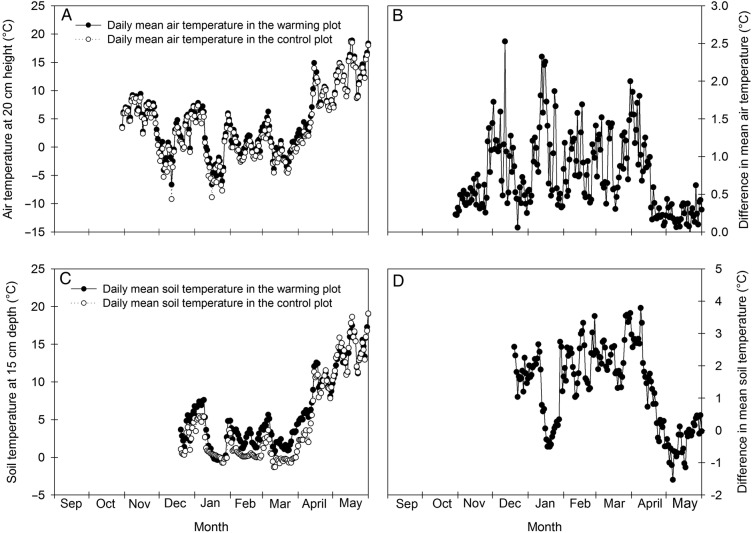
Figure 1.
Daily mean air (A) and soil (C) temperatures (°C) at 20 cm height or ∼15 cm depth, respectively, in the control and warming plots during the experimental period. Also shown are the differences in daily mean temperatures between the warming and control plots in the air (B) and the soil (D).

