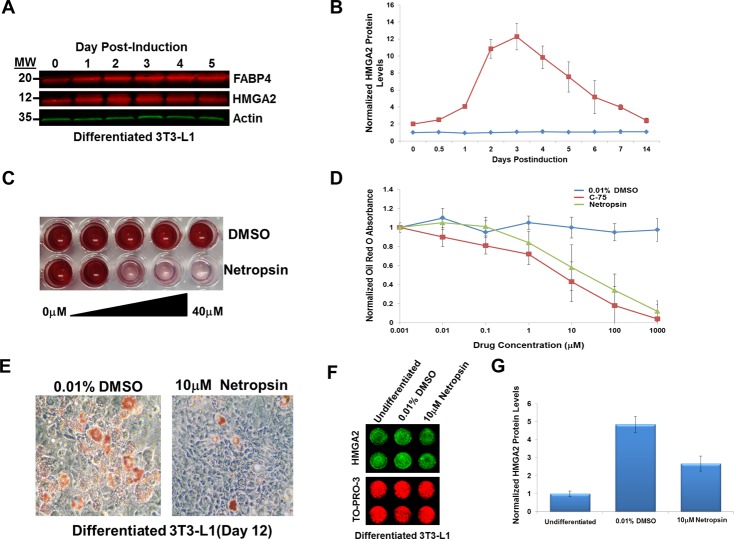
Figure 5.
Inhibition of HMGA2 by netropsin prevents 3T3-L1 adipogenesis. (A) Western blot analysis was used to confirm the increased expression of HMGA2 during adipogenesis. FABP4 was used as a control for increased gene expression during early adipogenesis, while actin was used as a loading control. (B) The fluorescent intensity of HMGA2 expression was quantified using the Image Studio Software (LI-COR Bioscience). The expression level of HMGA2 was measured across four biological replicates. (C) Adipogenesis was quantitatively measured by Oil Red O staining of 3T3-L1 cells. This method was employed to calculate the IC50 of Netropsin for this process over a dose curve. An image of this approach is displayed. (D) The absorbance of Oil Red O was determined using absorbance at 492 nm. C-75, an inhibitor of fatty acid synthase, was used as a control for inhibition of adipogenesis. (E) Oil Red O staining was also assessed qualitatively in the presence and absence of netropsin using phase microscopy. (F) The impact of netropsin exposure on HMGA2 expression levels was assessed using an in-cell western approach. TO-PRO-3 was used to normalize HMGA2 expression levels to cellular DNA content. (G) Normalized HMGA2 expression was assessed in 3T3-L1 cells exposed to DMSO and netropsin.

