
Figure 2.
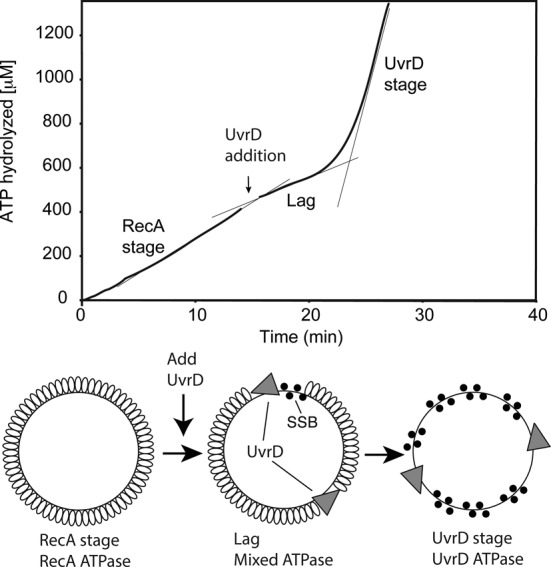
UvrD inhibits RecA-catalyzed ATPase activity. Reactions were carried out as described in Materials and Methods, and contained 3 μM circular M13mp18 ssDNA and 2 μM RecA protein. The reaction was initiated by addition of ATP (3 mM) and SSB (0.3 μM) as a mixture at t = 0. In the reaction shown, 50 nM UvrD (30 nM) was added at the point indicated by the arrow. The data following this addition have been corrected for a slight decline in absorption caused by a dilution effect. The ATP consumption profile can be divided into three stages. The first stage (prior to UvrD addition) reflects the constant rate of ATPase activity by RecA in the presence of ATP and DNA. A lag stage immediately follows the addition of UvrD and is defined by a decline in ATPase rate. The final stage is the UvrD stage, characterized by a large increase of ATP consumption (greater than the highest level of ATPase possible due to the RecA protein present) attributed to UvrD translocation on the DNA after RecA removal. Confirmation of RecA removal is presented in subsequent figures.