
Figure 1.
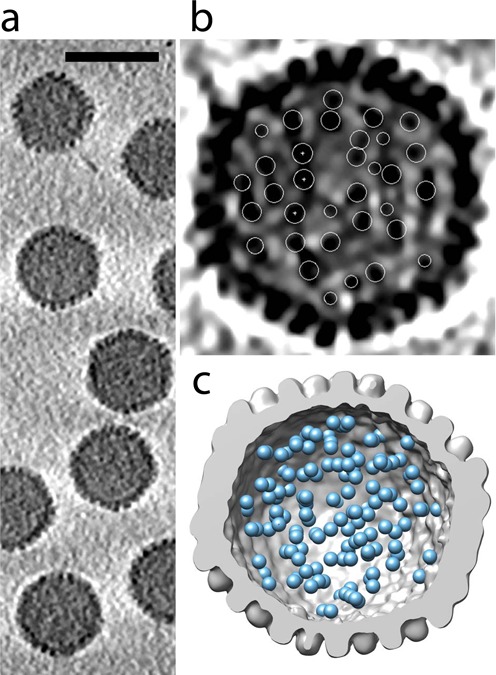
(a) Central section of a representative tomogram showing the punctate pattern in the adenovirus core. The bar represents 100 nm. (b) Central section of a single virus particle. The highest density regions are shown in black. Densities identified as adenosomes are encircled in white. Notice that circular outlines have different radii because they are cross-sections of spherical markers used for picking the adenosome centers in 3D. Central white dots in some of the circles correspond to the center of the spherical marker, i.e. the adenosome position as used for statistical analyses. (c) Surface rendering showing the adenovirus capsid cut open, obtained from averaging 20 individual virus tomograms after aligning with respect to an icosahedral reference (gray). The core density has been computationally removed and in its place, cyan spheres 4.5 nm in diameter indicate the positions of adenosomes for the viral particle shown in (b).