
Figure 1.
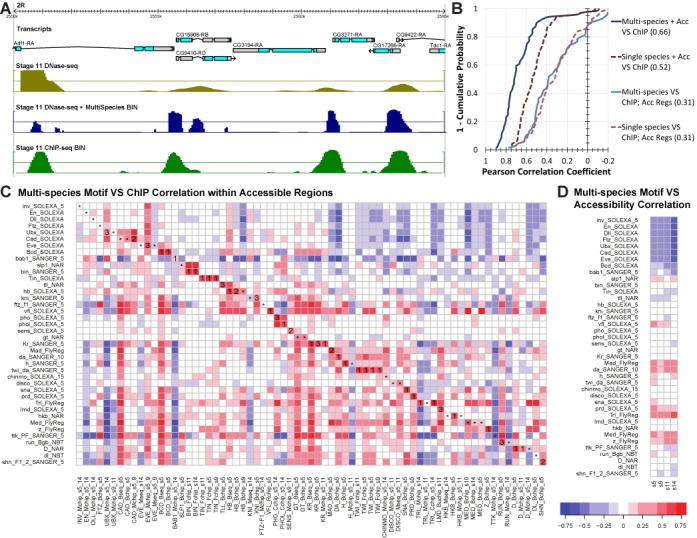
Motifs and DNA accessibility together accurately predict TF–DNA binding. (A) Scoring profiles around a typical Drosophila gene locus. The positions of the genes (light blue) are shown in this 15 kb browser view. The scoring profiles depicted are, from top to bottom, the chromatin accessibility from DNaseI-seq of the stage 11 embryo, the multi-species motif scores of BIN within accessible regions (top 10% of accessible windows), and finally the DNA binding of BIN from a ChIP-seq experiment in the stage 11 embryo. (B) Inverse cumulative frequency distributions for four evaluations. Each line plots for a given correlation value (x-axis), the percentage of the 69 ChIP sets (y-axis) that are greater than that correlation value. The evaluations using multi-species (single-species) scores are solid blue (dotted red) lines. The darker lines represent evaluations between ChIP scores and ‘motif + accessibility’ scores, while the lighter lines represent evaluations comparing ChIP scores to ‘motif only’ scores in only accessible regions. (C) Pairwise correlation between ChIP scores and motif scores within accessible genomic regions. The columns of the heatmap represent the 69 ChIP named for the assayed TF, laboratory source, and developmental stage. The rows represent the experimentally determined motifs of the 40 corresponding TFs. Each cell is colored for the Pearson correlation between 2000 windows selected to have 1000 non-coding, accessible ChIP profile peaks and 1000 non-coding, accessible random regions. In a cell where the motif and ChIP profile represent the same TF, the rank (or star if rank>3) of that motif by correlation among the 40 TFs is enumerated. (D) Correlation of accessibility scores with motif only scores from different motifs. Similar to (C) except instead of using scores of ChIP profiles we used the four DNaseI-seq chromatin accessibility profiles named for their developmental stage. The Spearman correlation is calculated on 2000 windows selected to have 1000 non-coding accessibility peaks and 1000 non-coding random regions.