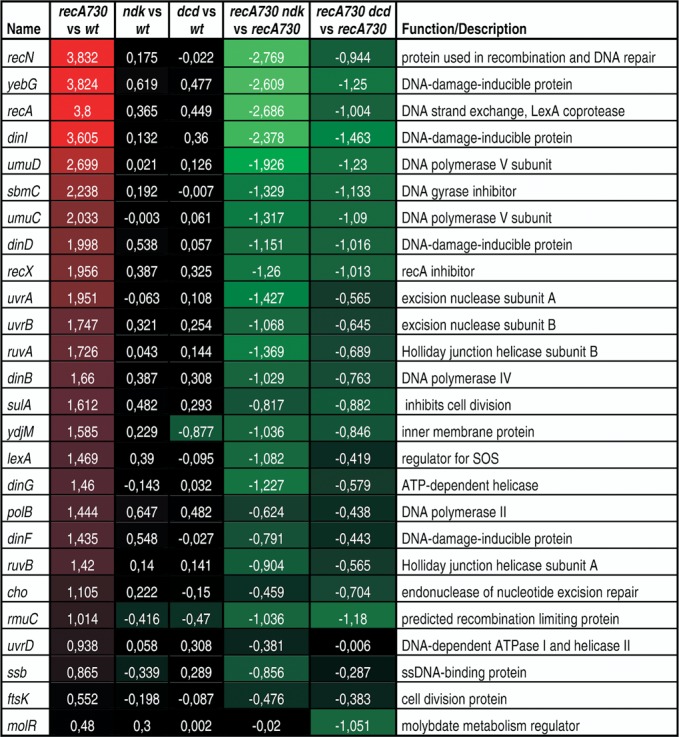
Figure 1.

Microarray analysis on recA730 and related strains. Shown are the log2 values for the fold increase (or decrease) in mRNA expression determined using the Agilent E. coli Gene Expression Microarray System for the indicated comparisons. See the Materials and Methods section for details. Red colors indicate increased gene expression, green color reduced expression. Strains used were EC9428 (wt), EC9461 (dcd), EC9487 (ndk), EC9477 (recA730), EC9471 (recA730 dcd) and EC9503 (recA730 ndk) (see Table 1).
